
The 7 Revenue Cycle Stages and Where Practices Lose Money
The 7 revenue cycle stages with 2026 benchmarks for each: charge lag, clean claim rate, denial cost, and the days A/R sits in every stage.
The 7 revenue cycle stages are the handoffs a claim passes through between the patient's first appointment and the money landing in your account: registration and eligibility, authorization and financial clearance, charge capture and coding, claim submission, adjudication and payment posting, denial management and appeals, and patient collections.
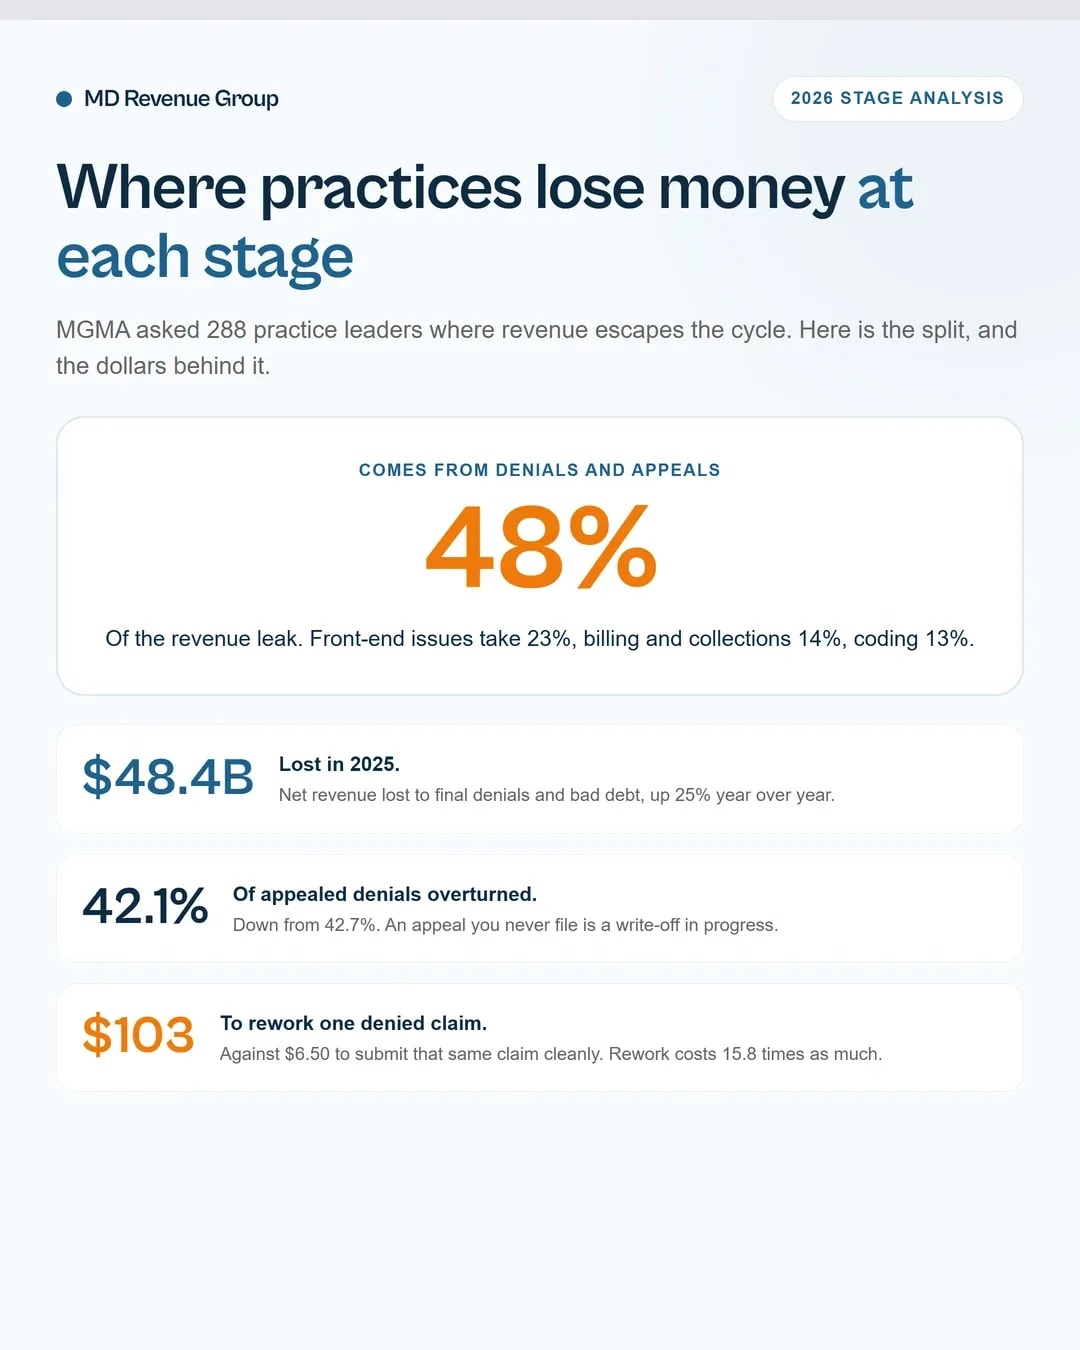
The leak concentrates hard. MGMA asked 288 practice leaders in January 2026 where revenue escapes the cycle. Denials and appeals accounted for 48% of it, front-end issues 23%, billing and collections 14%, coding 13%, and charge posting 2%. Kodiak Solutions put the dollar figure at $48.4 billion in net revenue lost to final denials and bad debt during 2025, up 25% in a single year.
This guide walks the 7 revenue cycle stages one at a time, attaches a 2026 benchmark to each one, and shows you where the money leaves and what it costs per stage.
Key takeaways
- Denial management is 48% of the revenue leak, according to a January 2026 MGMA poll of 288 practice leaders.
- Cost to rework a denied claim: $103. Cost to submit it cleanly: $6.50.
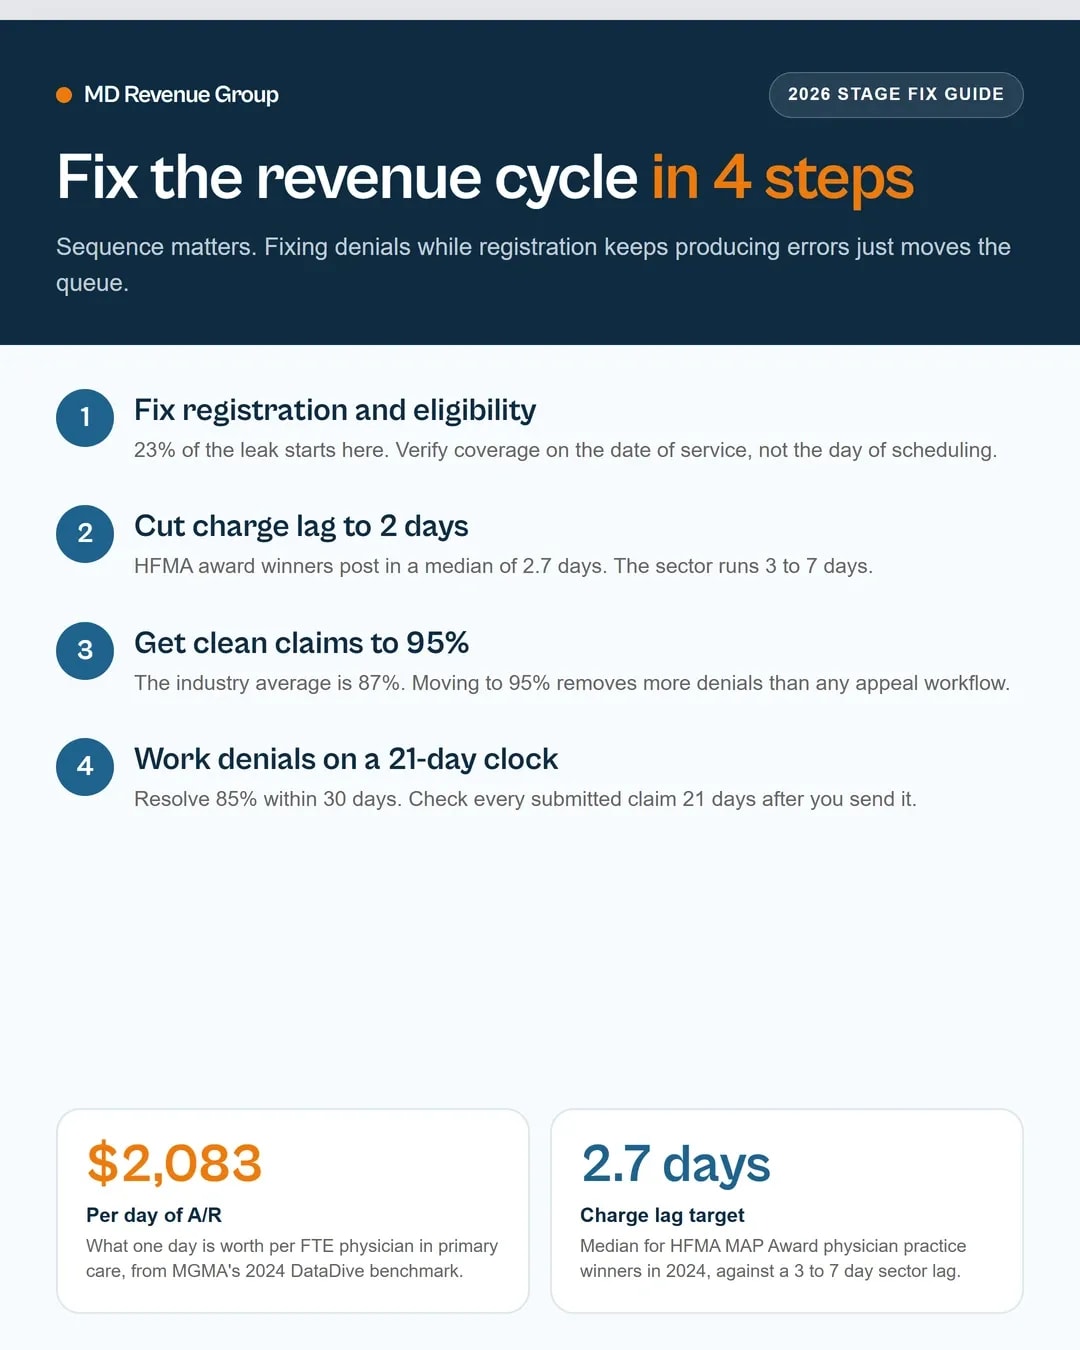
- Charge lag: physician practice winners of HFMA's MAP Award posted charges in a median of 2.7 days in 2024.
- Medicare Advantage pays clean claims in 30 to 45 days, against 10 to 14 days for traditional Medicare.
- Patient responsibility is now 7.3% of net revenue, and providers collect 42.4% of it.
What the 7 revenue cycle stages are
There is no single official list. HFMA's patient-centric model uses 21 steps across 3 phases. Vendors publish 7-step, 8-step, and 12-step versions, and the counts don't line up with each other.
35 days in AR is the benchmark. Anything over 50 is uncollected revenue.
We conduct a forensic 90-day cash flow audit to identify unworked claims, fee schedule underpayments, and clearinghouse leaks.
Audit My Cash Flow Leaks →Here is the 7-stage version, with where each stage's clock starts and stops.
Stage | What happens | Clock runs from |
|---|---|---|
1. Registration and eligibility | Scheduling, check-in, insurance verification, referral checks | Appointment booked |
2. Authorization and financial clearance | Prior authorization, benefit verification, patient estimates | Visit date approaching |
3. Charge capture and coding | Documentation review, charge entry, coding, claim edits | Date of service |
4. Claim submission | Scrubbing, batch, electronic transmission, acknowledgment | Charge posted |
5. Adjudication and payment posting | Payer adjudication, remittance, contractual adjustment, posting | Claim received by payer |
6. Denial management and appeals | Root cause, rework, appeal, payer follow-up | Denial received |
7. Patient collections and A/R | Statements, payment plans, collections, write-off decisions | Payment posted |
Each stage has its own owner, its own failure mode, and its own clock. A practice that tracks one blended days-in-A/R number loses the ability to see which one of the 7 stages broke.
MDRG's revenue cycle management service runs all 7 with separate measurement on each.
Where practices lose money, stage by stage
Stage 1: Registration and eligibility
This stage leaks silently. Nothing shows up on a report until the claim comes back.
Experian Health's 2025 survey of 250 revenue cycle leaders found 26% say 10% of their denials come from inaccurate or incomplete data collected at patient intake. A December 2020 MGMA poll of 619 practice leaders put prior authorization at 42% of denials and demographic issues at 29%.
Attendance failures hit the same stage. MGMA's August 2026 poll of 190 practice leaders found 32% of medical groups report higher patient no-show rates year to date compared with 2025. MGMA's 2025 DataDive found a 19.95% appointment cancellation rate in its 2024 single-specialty aggregate, and only 27.4% of canceled visits were rescheduled within 30 days.
Then there's the filing clock, which starts here and never stops. 42 CFR 424.44 gives Medicare 1 calendar year from the date of service. Commercial plans commonly allow 90, 120, or 180 days, and Medicaid varies by state.
State deadlines differ enough to matter on their own. Our medical billing services in New Jersey page covers that state's filing windows, and every state page covers the rest.
Stage 2: Authorization and financial clearance
This stage is where labor hours disappear.
The AMA's prior authorization survey found physicians complete an average of 39 prior authorizations a week and spend about 13 hours on the process. The 2025 survey found 32% of physicians report those requests are often or always denied.
Automation is still thin here. CAQH's 2025 Index put electronic prior authorization adoption at 40%, up from 31% in the 2023 Index but far behind claim status inquiry at 81%.
AHA's 2026 data show the scale: MA insurers made roughly 53 million prior authorization determinations in 2024, about 1.7 per enrollee, and the share of decisions providers appealed rose from 7.5% in 2019 to 11.5% in 2024.
A prior authorization that takes 13 hours a week to chase is a staffing decision, not a paperwork problem.
Stage 3: Charge capture and coding
Charge lag is the clock here. It runs from date of service to the day the charge posts to your billing system.
The one real distribution of charge lag anywhere comes from HFMA's MAP Award for High Performance in Revenue Cycle, physician practice winners: a median of 2.7 charge lag days in 2024, 2.4 in 2023, and 1.9 in 2022, with the 25th percentile at 3.2 days in 2024. Their median net days in A/R was 21.9.
MGMA's 2026 target is encounters closed within 72 hours and charges posted within 2 days. The sector runs a 3 to 7 day lag, and HFMA's MAP Key CL-2 counts a charge as late if it posts more than 3 days after service. Late charges should stay at 2% of total charges or less.
Coding carries its own benchmark. A peer-reviewed 2024 revenue cycle review in Plastic and Reconstructive Surgery Global Open sets coding accuracy above 95% and coding productivity above 95%, meaning less than 5% of the coding load should sit in a queue at any time.
Charge lag days: what they cost and how to measure them has the filing-window math.
Stage 4: Claim submission
The economics of this stage are stark. HFMA's Fall 2025 data put the national average cost to submit the initial claim at $6.50 and the national average cost to rework a denied claim at $103.
Clean claim rate is the measure that tells you whether the stage worked. HFMA's target is 98%. A peer-reviewed revenue cycle review sets 95% or more. The American Billing Association's 2026 benchmark puts the industry average at 87%, the top quartile at 94%, and the top 10% at 97% or better.
First-submission denial rate tells you the same thing from the other end. MGMA benchmarks it at 7% to 8% across the past four years, and its 2025 Financials and Operations data say targeted process fixes can push it below 5%.
How to submit a clean insurance claim the first time covers the transmission path.
Clean claim rate benchmarks breaks down the numbers by practice type.
Stage 5: Adjudication and payment posting
This is where the calendar gets expensive.
Kodiak Solutions put average time to insurance payment at 55.2 days in 2025, improving from 57.4 days in 2024. A peer-reviewed revenue cycle review gives a sharper payer-level view: private insurance pays in 12 to 20 days, Medicare in 18 to 30 days, and workers' compensation in 55 to 75 days.
Medicare Advantage is the one dragging the blend. MGMA reports MA plans take 30 to 45 days to pay a clean claim against 10 to 14 days for traditional Medicare. Epic Research, working from more than 550 million encounters, found that in the emergency department, self-pay and Medicare Advantage were the only two coverage types to grow between 2022 and 2026. MA rose from 10.3% to 13.0% of encounters while traditional Medicare fell from 12.8% to 11.9%.
There's no federal prompt-pay standard for in-network MA claims. The AHA's May 2026 fact sheet documents that gap. Two bills are trying to close it: the Medicare Advantage Prompt Pay Act (H.R. 5454), which would require plans to pay 95% of clean claims within 14 days, and the Medicare Advantage Improvement Act (H.R. 8375), which would align in-network MA payment to Original Medicare's 30-day standard. Both are bills.
One more number for this stage: Milliman found 2025 national commercial reimbursement at roughly 196% of Medicare fee-for-service rates. A commercial dollar carries about twice the value of a Medicare dollar, which is why a commercial denial hurts more than its face value suggests.
Stage 6: Denial management and appeals
This is 48% of your leak.
Kodiak's 2025 numbers: average initial denial rate 11.6%, median final denial rate 2.7% after rising from 2.5%, and an overturn rate that fell to 42.1% from 42.7%. Final denials and bad debt together cost the industry $48.4 billion in 2025.
The cost to fight denials keeps climbing. Premier's 2025 data on 280 hospitals put the cost to fight denials at $57.23 per claim in 2023, up from $43.84 in 2022, and claims adjudication at $25.7 billion in 2023, up 23% year over year.
HFMA's operating target is to resolve 85% of denials within 30 days. A peer-reviewed revenue cycle review recommends checking every claim's status 21 days after submission, because a denial nobody looks at is a write-off nobody notices.
AHIMA's Journal of AHIMA review adds the recovery math: as many as 60% of returned claims are never resubmitted, and as many as two-thirds of rejected claims are recoverable.
How to reduce claim denials covers the prevention side.
Stage 7: Patient collections and A/R
Patient balances grew faster than anyone planned for. Kodiak found patient responsibility rose from 6.8% to 7.3% of net revenue between 2024 and 2025, while health systems collected less of it, dropping from 45.1% to 42.4%.
HFMA and PayZen's May 2026 survey of 205 revenue leaders puts patient billings at 12% of net patient revenue on average, with health systems collecting only 31% of patient billings. The average patient can realistically pay $82 a month, and 72% of polled revenue leaders don't have a handle on their own default rates.
Point-of-service collection is the lever people underuse. MGMA's data show practices collected 72% of copayments at time of service in 2024 but only about 27% of other patient-due balances. MGMA's benchmarking shows TOS copay collection fell from about 90% pre-pandemic in 2019 to 56% in 2022, while TOS collection of other patient-due balances rose from about 15% to 39%.
Then there's the aging report. HFMA's MAP Key AR-1 splits A/R into 0 to 30, 31 to 60, 61 to 90, 91 to 120, and 120-plus buckets, and the buckets have to sum to 100%. HFMA's targets are under 10% of A/R over 90 days and under 30% for self-pay balances over 90 days.
MGMA's Better Performer data show what the tail costs. Better Performers collect 5% to 8% more revenue in the first 30 days and hold 4% to 7% less A/R over 120 days. In multispecialty groups, the 120-plus day advantage widened to 7.28% by December 2023. The gap is moving to the tail.
One practice in MGMA's July 2026 poll kept insurance A/R within 28 days and still reported 32 days total, because self-pay balances pushed the number up. Another cut days in A/R from 67 to under 34 after an RCM overhaul.
How days in A/R benchmarks are calculated covers the aging math.
How to calculate your leakage by stage
MGMA's leak poll doesn't include claim submission or adjudication as separate categories. Work that fails in those stages shows up later, as denials or as uncollected balances.
Here is that allocation.
Stage | Share of revenue leak | Source category |
|---|---|---|
6. Denial management and appeals | 48% | Denials and appeals |
1 and 2. Registration, eligibility, authorization | 23% | Front-end issues |
3. Charge capture and coding | 15% | Coding 13% plus charge posting 2% |
5 and 7. Adjudication, posting, collections | 14% | Billing and collections |
4. Claim submission | Inside the other categories | Work fails here and lands in stages 6 and 7 |
Now put money on it. MGMA benchmarks first-submission denials at 7% to 8%. A practice billing 1,000 claims a month takes on 70 to 80 denials every month. At $103 each, that is $7,210 to $8,240 a month in rework labor, against $6,500 to submit all 1,000 claims cleanly in the first place. Kodiak's blended hospital and physician initial denial rate of 11.6% pushes the same calculation higher.
That's an MDRG calculation. Both cost figures come from HFMA's Fall 2025 data and the denial rate comes from MGMA's first-submission benchmark.
Run it on your own numbers: denials multiplied by $103, compared against total claims multiplied by $6.50.
One more figure to carry into the conversation with your CFO. MGMA's DataDive benchmark for 2024 puts median total medical revenue per FTE physician at $760,383 in primary care, $697,712 in nonsurgical groups, and $687,652 in surgical groups. That's $2,083 per day per physician in primary care, $1,912 in nonsurgical, and $1,884 in surgical.
A 10-provider primary care group stuck 5 days past its target is sitting on $104,150 of working capital it has already earned.
The order to fix the cycle in
Sequence matters. Fixing stage 6 while stage 1 keeps producing errors just moves the queue.
1. Registration and eligibility first. It's 23% of the leak, and every dollar of prevention costs a fraction of a rework. Verify eligibility on the date of service, not the date of scheduling.
2. Cut charge lag. HFMA's award winners post in 2.7 days. The sector runs 3 to 7. Every day of lag burns filing runway you may need 90 or 365 days from now.
3. Get the clean claim rate to 95% before you chase 98%. The American Billing Association puts the industry average at 87%. Moving from 87% to 95% removes more denials than any appeal workflow you can build.
4. Work the denial queue on a 21-day clock. Check every submitted claim's status 21 days out, and target 85% resolution within 30 days. An unworked denial is a write-off in progress.
5. Attack the 120-plus day bucket. Better Performers hold 4% to 7% less there, and that's where the collection probability collapses. Take it before you take anything else.
6. Instrument patient collections. 42.4% collected on a balance that's 7.3% of net revenue is the largest single line item most practices never work.
Measure it monthly. Days in A/R, clean claim rate, initial denial rate, denial resolution rate, net collection rate, cost to collect, and the aging distribution. If you can't split insurance A/R from patient A/R, you're managing a blended number that hides the problem.
Frequently asked questions
What are the 7 stages of the revenue cycle? Registration and eligibility, authorization and financial clearance, charge capture and coding, claim submission, adjudication and payment posting, denial management and appeals, and patient collections. HFMA's own model breaks the same work into 21 steps across 3 phases.
Which stage causes the most denials? Stage 6 handles the denials, and stage 1 and stage 2 create them. MGMA's January 2026 poll attributes 48% of the revenue leak to denials and appeals and 23% to front-end issues.
How long should each stage take? Charge lag should be 2 days or less. Days to pay run 12 to 20 days for private insurance, 18 to 30 for Medicare, and 55 to 75 for workers' compensation. HFMA wants 85% of denials resolved within 30 days of receipt.
How much does a denial cost a small practice? $103 to rework a denied claim, per HFMA's Fall 2025 data. At 100 claims a month and a 10% denial rate, that's 10 denials and $1,030 a month in rework labor.
What is the biggest revenue leak in the revenue cycle? Denials and appeals, at 48% of the total, according to MGMA's January 2026 poll of 288 practice leaders.
How do you calculate charge lag? Days between the date of service and the date the charge posts to the billing system. HFMA's MAP Key PB-4 tracks it, and CL-2 counts the share of charges posted more than 3 days after service.
Find out which stage is leaking in your practice
Send us your denial report and your A/R aging file. We'll tell you which of the 7 stages is costing you money and what it's worth per month in rework. Request a free revenue audit.
See your revenue leaks in dollars.
Get a forensic 90-day cash flow audit of your practice. 100% confidential, 48-hour delivery, zero obligation.