
Clinical vs Technical Denials: A Playbook
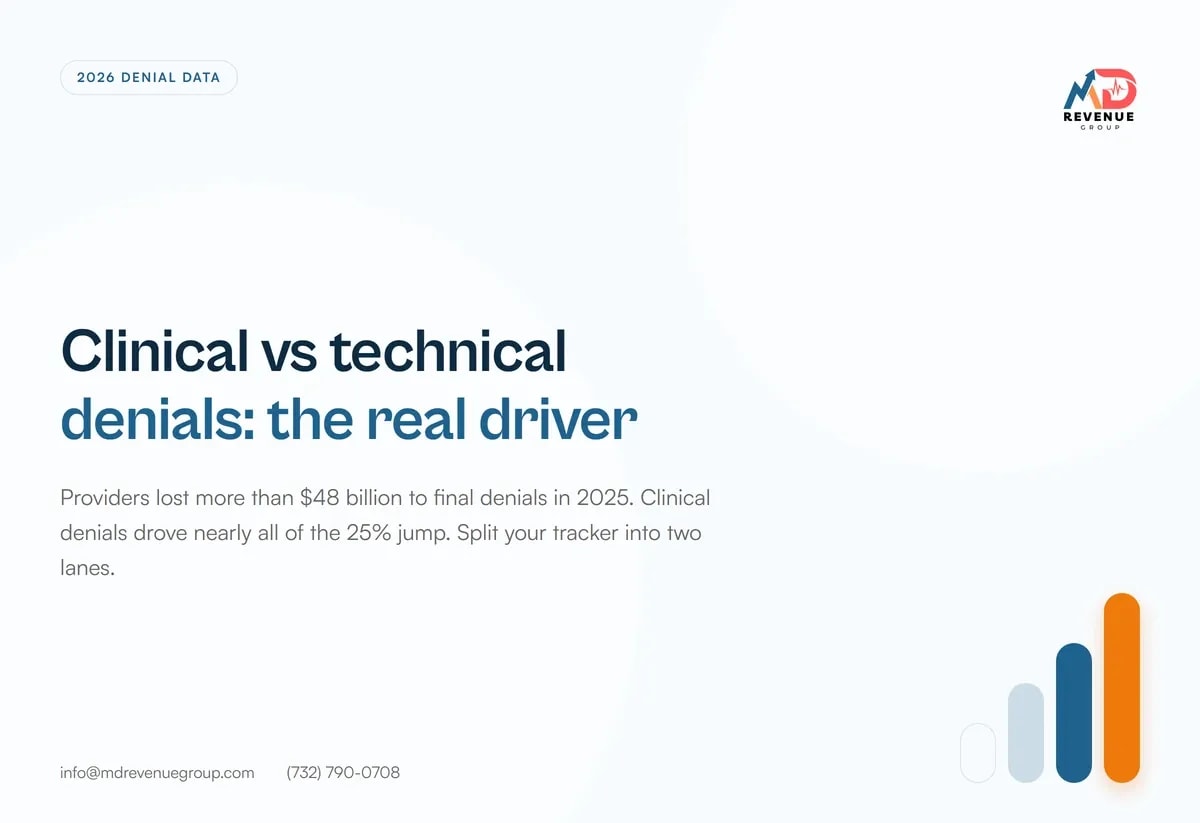
Clinical vs technical denials drove a 25% jump in revenue leakage. Find which lane your practice sits in and run the 4 fixes that cut preventable volume.
Clinical vs Technical Denials: A Playbook
Clinical vs technical denials are two separate problems, and the 2026 data says one of them is driving nearly the entire increase. That is the finding underneath every other number in the data, and it is the line most practices read past.
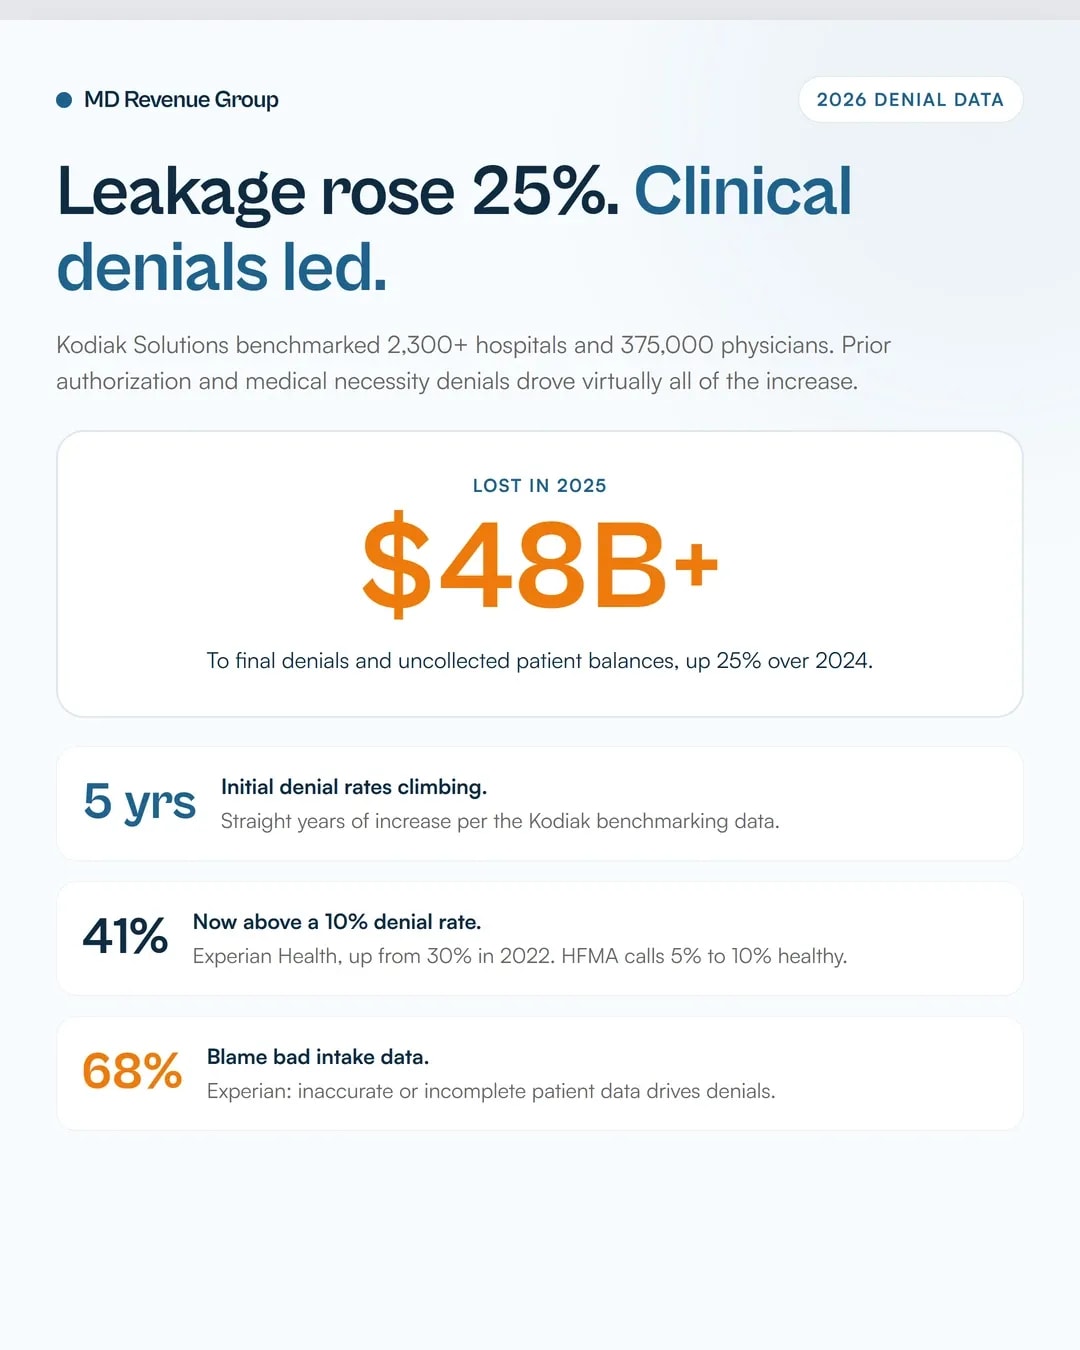
Kodiak Solutions' benchmarking report, released at the end of March 2026 and covering more than 2,300 hospitals and 375,000 physicians, found net revenue leakage grew 25% in 2025. Providers on the platform lost more than $48 billion to final denials and uncollected patient balances.
The sentence after the headline is the one that matters. Clinical denial rates, the ones tied to missing prior authorizations and disputed medical necessity, accounted for virtually all of that increase. Coding errors did not drive it. Registration mistakes did not drive it.
So here is the working definition for your team. Clinical denials are disagreements. Technical denials are data problems. A disagreement gets resolved by making an argument. A data problem gets resolved by fixing a field. Practices that treat both the same way keep spending their budget on the lane that was never growing.
Key takeaways
- Kodiak found net revenue leakage up 25% in 2025, with more than $48 billion lost to final denials and uncollected patient balances.
- Clinical denials tied to prior authorization and medical necessity accounted for virtually all of that increase.
- MGMA's January 2026 poll ranked denials and appeals as the top revenue cycle leak at 48%, with front-end issues at 23%. That 23% understates the real front-end problem.
- The AMA's May 2026 survey of 1,000 physicians found 40 prior authorization requests per physician per week, and 32% often or always denied.
- Four fixes move the number: split the tracker into two lanes, timestamp every eligibility and authorization check, add clinical review before submission, and give one person real ownership.
Why are claim denials rising in 2026?
Five separate datasets point the same direction, and they were collected for different purposes by different organizations.
Source | Period | Finding |
|---|---|---|
Kodiak Solutions | 2025, 2,300+ hospitals, 375,000 physicians | Net revenue leakage up 25%; more than $48 billion lost to final denials and uncollected patient balances |
Kodiak Solutions | Multi-year trend | Initial denial rates have risen for five straight years |
Experian Health | 2025 State of Claims, 250 professionals | 41% of providers report denial rates above 10% |
Experian Health | 2022 to 2025 trend | Share above 10% denial rates climbed from 30% to 38% to 41% |
HFMA | Benchmark | A 5% to 10% denial rate is considered healthy |
Experian polled 250 healthcare professionals responsible for financial, billing, or claims management decisions between June 23 and July 3, 2025. The 41% figure has moved in one direction every year since the survey began in 2022.
HFMA's definition of a denial is worth knowing because it is the industry's shared vocabulary: any intentional reduction of payment resulting from failure to provide medically necessary services in an appropriate setting, failure to follow the payer's technical guidelines, or failure to consistently document for services provided. Two clauses in that single sentence point at the two lanes.
Where does that leave a 4-provider practice? You are competing against organizations that now have denial analytics teams. Our guide to denial management for medical billing covers the recovery workflow once a denial lands. This article covers how to stop generating them.
What is the difference between clinical and technical denials?
HFMA describes the split with unusual clarity. Technical denials, the ones tied to administrative functions, usually require a volume-driven approach to management. Clinical denials, tied to medical necessity or treatment, tend to be more varied, more complex, and they are often camouflaged by technical denials.
ACDIS, the professional association for health care documentation integrity specialists, uses a harder distinction. Clinical denials are known as hard denials, requiring an appeal to request reconsideration. Technical denials are known as soft denials, usually resolvable by resubmitting a corrected claim or supplying additional information.
Clinical denials | Technical denials | |
|---|---|---|
Root cause | A payer disagrees with the medical decision | A field, rule, or process step is wrong |
Typical triggers | Medical necessity, prior authorization, level of care, length of stay, DRG downgrade | Wrong payer ID, missing modifier, lapsed coverage, duplicate claim, timely filing, unsubmitted authorization |
Who decides | A medical reviewer or utilization management nurse | An edits engine |
Resolution | Appeal with clinical evidence | Correct and resubmit |
Time to resolve | Days to months, often never | Hours to days |
Fix | Upstream, before the service | Upstream, before the claim |
Volume effect | Lower volume, higher dollars at risk | Higher volume, lower dollars each |
Two things about that table matter more than the rest.
The dollar concentration. Technical denials are high volume and low severity. Clinical denials are lower volume and carry the permanent loss risk. Once a payer decides a service, day, or level of care was not medically necessary, your appeal depends on producing convincing clinical evidence.
The camouflage. HFMA's warning that clinical denials get camouflaged by technical ones means a single claim can carry both. A missing authorization that gets flagged as a technical edit on the surface may sit on top of a medical necessity dispute underneath. If your tracker counts it once, in the technical lane, you will undercount the clinical problem for as long as you run the report.
If you want the category split applied to your own numbers, our free revenue audit sorts your denial reasons into both lanes and reports which one is actually growing.
Why do most practices fix the wrong problem?
MGMA's January 2026 poll asked 288 medical group leaders where their revenue cycle leaks the most. The results read like a ranking of problems, and they are usually quoted as one.
Revenue cycle leak | Share of medical group leaders |
|---|---|
Denials and appeals | 48% |
Front-end issues | 23% |
Billing and collections | 14% |
Coding | 13% |
Charge posting | 2% |
The 48% figure gets read as denials being twice the size of the front-end problem. Sitting through enough of these reviews changes that read.
Denials are loud. Someone has to open the letter, decode the reason, and decide whether to fight it. A front-end mistake is quiet.
A rushed eligibility check on a Tuesday does not become a denial until three weeks later, and by then nobody connects the two events. The 23% figure measures the size of the front-end problem people have learned to notice.
Experian's data backs the same point from a different angle. Its 2025 State of Claims found 68% of providers saying inaccurate or incomplete patient data at intake drives denials, with named root causes of missing or inaccurate data at 50%, authorization issues at 35%, and flawed patient registration data at 32%.
So the honest reading of the MGMA poll is two statements at once. Denials and appeals are the biggest leak that reaches your desk. Front-end failures are the biggest leak that causes them, and they are invisible in the number.
Our article on how to reduce claim denials covers the prevention sequence. The measurement discipline that makes it work is the subject of this one.
How bad is the prior authorization problem right now?
The AMA's 2025 Prior Authorization Physician Survey, released in May 2026, surveyed 1,000 practicing physicians, split 400 primary care and 600 specialists. The survey was fielded in December 2025 as a 44-question instrument through the Medscape panel, with respondents screened to confirm they practice at least 20 hours of patient care weekly and complete prior authorizations in a typical week.
The numbers are the workload and the trust problem at the same time.
AMA finding | Result |
|---|---|
Prior authorizations completed per physician per week | 40 |
Requests often or always denied | 32% |
Physicians who say prior auth delays care patients need | 95% |
Say medical necessity denials are consistently reviewed by a licensed and qualified clinician | 24% |
Say the 2025 insurer pledge will make a meaningful difference | 33% |
Say prior auth contributes to physician burnout | 94% |
Report denials have increased over the past five years | 74% |
Concerned AI may further increase denial rates | 60% |
Physician and staff time spent on prior auth weekly | About 13 hours |
Practices with staff who work exclusively on prior auth | 40% |
Say prior auth led to an adverse event for a patient | 26% |
Say prior auth negatively affects patient outcomes | 92% |
Say prior auth requirements lead to higher resource use | 88% |
Have watched a patient abandon treatment because of prior auth | 79% |
The 24% number is the one that explains the rest. Insurers pledged in June 2025, roughly 60 health carriers with deadlines spanning 2025 through 2027, that all medical necessity denials would be reviewed by a licensed and qualified clinician.
Only about one in four physicians report that is consistently happening. Among physicians who do peer-to-peer reviews, just 16% say the health plan representative often or always has the appropriate qualifications.
Speed has been tried. It has not delivered. Beginning Jan 1, 2026, Medicare Advantage organizations and several Medicaid and CHIP payers generally must decide expedited non-drug requests within 72 hours and standard requests within seven calendar days, and must give a specific reason when denying. Payer rules also require a specific denial reason now.
MGMA polled medical group leaders on whether that worked. In a Sept 1, 2026 poll with 178 applicable responses, 44% said prior authorization turnaround became slower in 2026 compared with 2025. Another 40% said about the same. 7% reported faster. 9% were unsure.
MGMA finding | Result |
|---|---|
Practices reporting slower prior auth turnaround in 2026 | 44% |
About the same | 40% |
Faster | 7% |
Unsure | 9% |
Practices whose staff access 7 or more payer portals weekly | 61% |
Practices naming eligibility and prior auth as staff's most time-consuming phone task | 45% |
Practices reporting prior auth burden increased in the prior 12 months | 90% |
MGMA's 2026 Regulatory Burden Report also ranked payer types by difficulty of obtaining authorization: Medicare Advantage first, then commercial plans, Medicaid, then Traditional Medicare.
The 61% figure on payer portals is the hidden cost. Staff time spent logging into seven or more portals to submit and track the same category of request is a workflow problem, and it sits upstream of every clinical denial in the clinical lane.
Why hiring your way out of this stops working
Adding staff is the reflex, and it buys real months. It stalls for two reasons that show up the same way across practices.
Payer rules outrun any single person. Dozens of payers, each rewriting its own precertification requirements on its own calendar. One person cannot track that surface area, and the part they miss becomes a denial.
The skill is different. Clinical denials need someone who can argue medical necessity to a medical reviewer. That is a different discipline from data accuracy, and an afternoon of onboarding does not teach it.
There is a second-order cost that practices rarely measure. MGMA's follow-up responses to the Sept 2026 poll flagged that a practice can shorten turnaround by adding an authorization specialist, and still pay more in administrative cost. Patients get answers sooner while the practice gets less efficient. The durable reductions come from payer requirement changes and better internal workflow.
4 fixes that target the right problem
None of these require new software. Each one requires a name and a date attached to it.
# | Fix | Owner | Cadence | What changes |
|---|---|---|---|---|
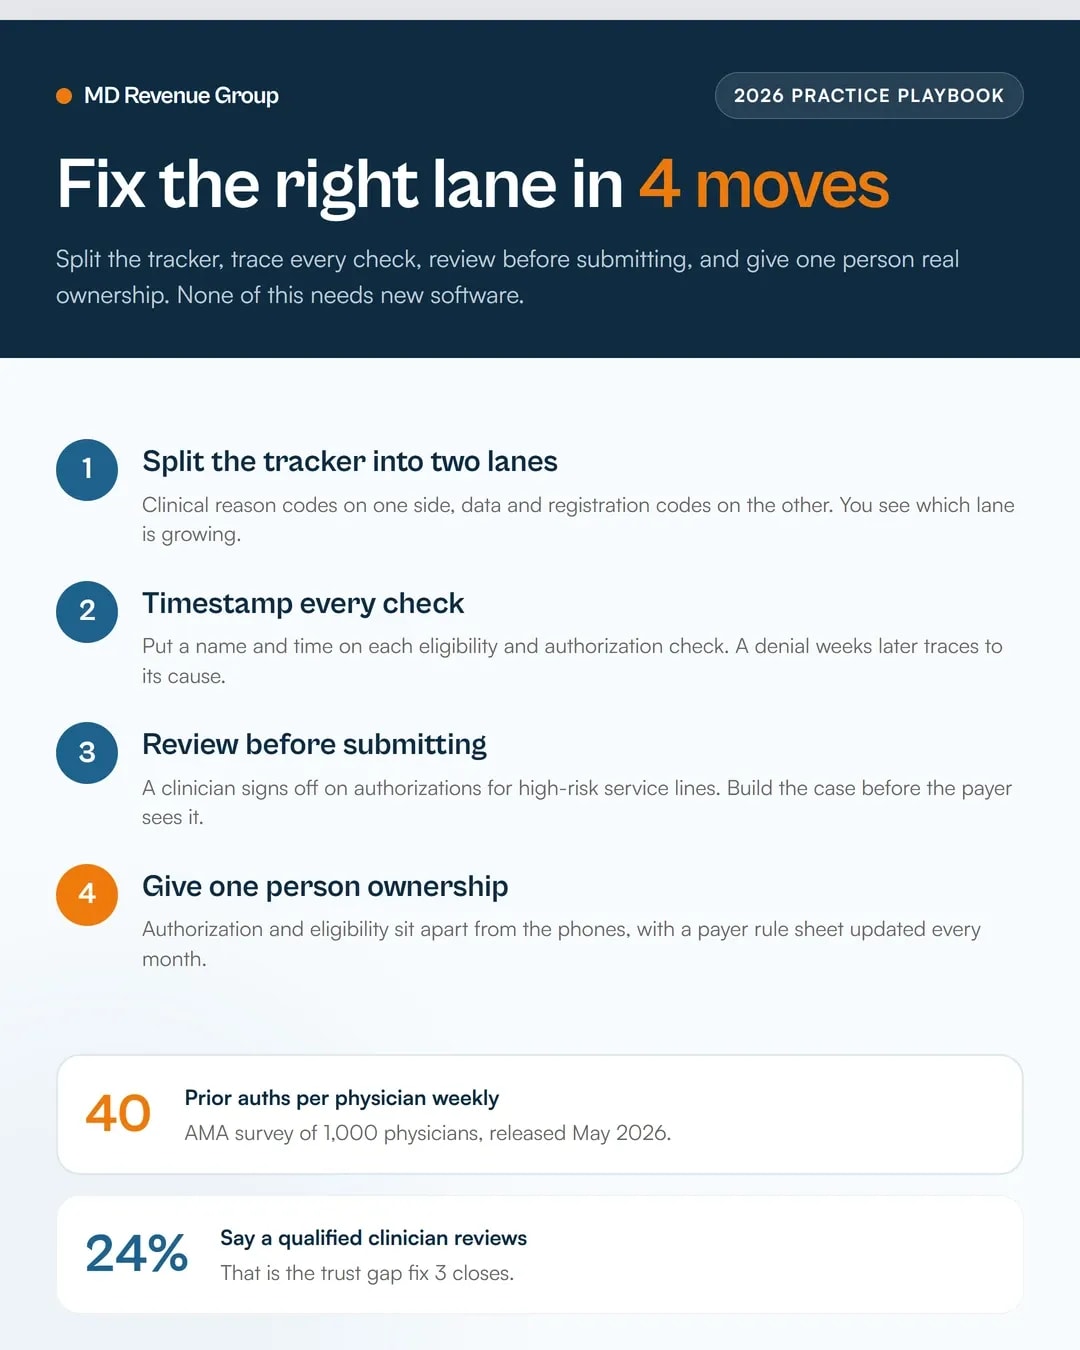
1 | Split the denial tracker into two lanes, clinical reason codes on one side and data or registration codes on the other | Billing manager | Monthly report | You see which lane is growing before you spend a budget cycle guessing |
2 | Put a name and timestamp on every eligibility and authorization check, not a checkbox | Front desk lead | Every check | A denial weeks later traces back to the exact step that caused it |
3 | Have a clinician or clinical liaison review authorization requests before submission on high-risk service lines | Clinical lead | Per request, high-risk lines only | First-pass approval rates move, because the medical necessity case is built before submission |
4 | Give one person dedicated ownership of authorization and eligibility, separate from phones and check-in, with a payer rule sheet updated monthly | Practice manager | Standing role | Rules stay current across dozens of payers instead of living in one person's memory |
Fix 1 is the one that unlocks the rest. A single blended denial report tells you denials went up. A two-lane report tells you the clinical lane went up 18% while the data lane held flat, and that changes every downstream decision.
Fix 2 sounds bureaucratic until you run the math. An eligibility verification without a name and a time cannot be traced to a claim three weeks later. Without that trace, you cannot tell whether the denial came from a wrong payer ID on intake or a medical necessity dispute. Both look identical on the remittance.
Fix 3 is the direct answer to the AMA's 24% finding. If a licensed clinician is reviewing the authorization before it goes out, you are building the case on your side of the table instead of arguing it from the outside after a denial.
Fix 4 is the fix that survives a staffing change. A payer rule sheet that names which payers and service lines require prior authorization confirmed before scheduling, updated monthly, outlives whoever built it.
Kodiak's guidance to its top-performing organizations is to direct more resources toward preventing clinical denials rather than appealing them afterward. Their framing of the metric that matters is worth borrowing: how much denial volume never happens in the first place.
For practices that need this run rather than advised, our revenue cycle management service builds the two-lane tracker and the timestamped check log as part of onboarding. Smaller groups usually start with a narrower scope, and our small practice medical billing page lays out how that works.
Frequently asked questions
Clinical denials occur when a payer disagrees with the clinical decision, such as medical necessity, level of care, or length of stay. Technical denials occur when data or process is wrong, such as a missing modifier, wrong payer ID, or lapsed coverage. Clinical denials require an appeal with clinical evidence. Technical denials usually resolve by correcting and resubmitting the claim.
Kodiak Solutions found net revenue leakage grew 25% in 2025 across more than 2,300 hospitals and 375,000 physicians, with providers losing more than $48 billion to final denials and uncollected patient balances. Clinical denials tied to prior authorization and medical necessity accounted for nearly all of that increase. Initial denial rates have now risen for five straight years.
HFMA considers a denial rate between 5% and 10% a healthy benchmark. Experian Health's 2025 State of Claims survey found 41% of providers now report denial rates above 10%, a figure that has climbed every year since the survey began in 2022, when the share was 30%. By 2024 it had reached 38%.
The AMA's May 2026 survey of 1,000 physicians found each completes about 40 prior authorization requests weekly, 32% report requests often or always denied, and only 24% believe medical necessity denials are consistently reviewed by a licensed clinician. Practices reduce these denials by having clinical staff review authorizations before submission on high-risk service lines and by tracking turnaround by payer.
Staffing helps for a while, then stalls. Payer rules change faster than one person can track across dozens of payers, and clinical denials require the ability to argue medical necessity, a different skill from data accuracy. Giving one person dedicated ownership of authorization and eligibility with a monthly-updated payer rule sheet is more durable than adding general front-desk capacity.
Find out which lane your denials are actually in. A free audit sorts your denial reasons into clinical and technical, shows you the dollar split, and names the workflow step generating the most. Request a free audit.