
Reduce Days in AR: What 2 Extra Days Actually Cost Your Practice
To reduce days in AR, start with the benchmark: the 2026 median rose 2.4 days. See what 5, 10 or 15 extra days cost at your volume and the playbook to fix it.

Reduce days in AR by finding the specific place they accumulate, then fixing the front end instead of chasing collections. The metric is total accounts receivable divided by average daily charges. Every point you take off it is working capital you can spend on payroll.
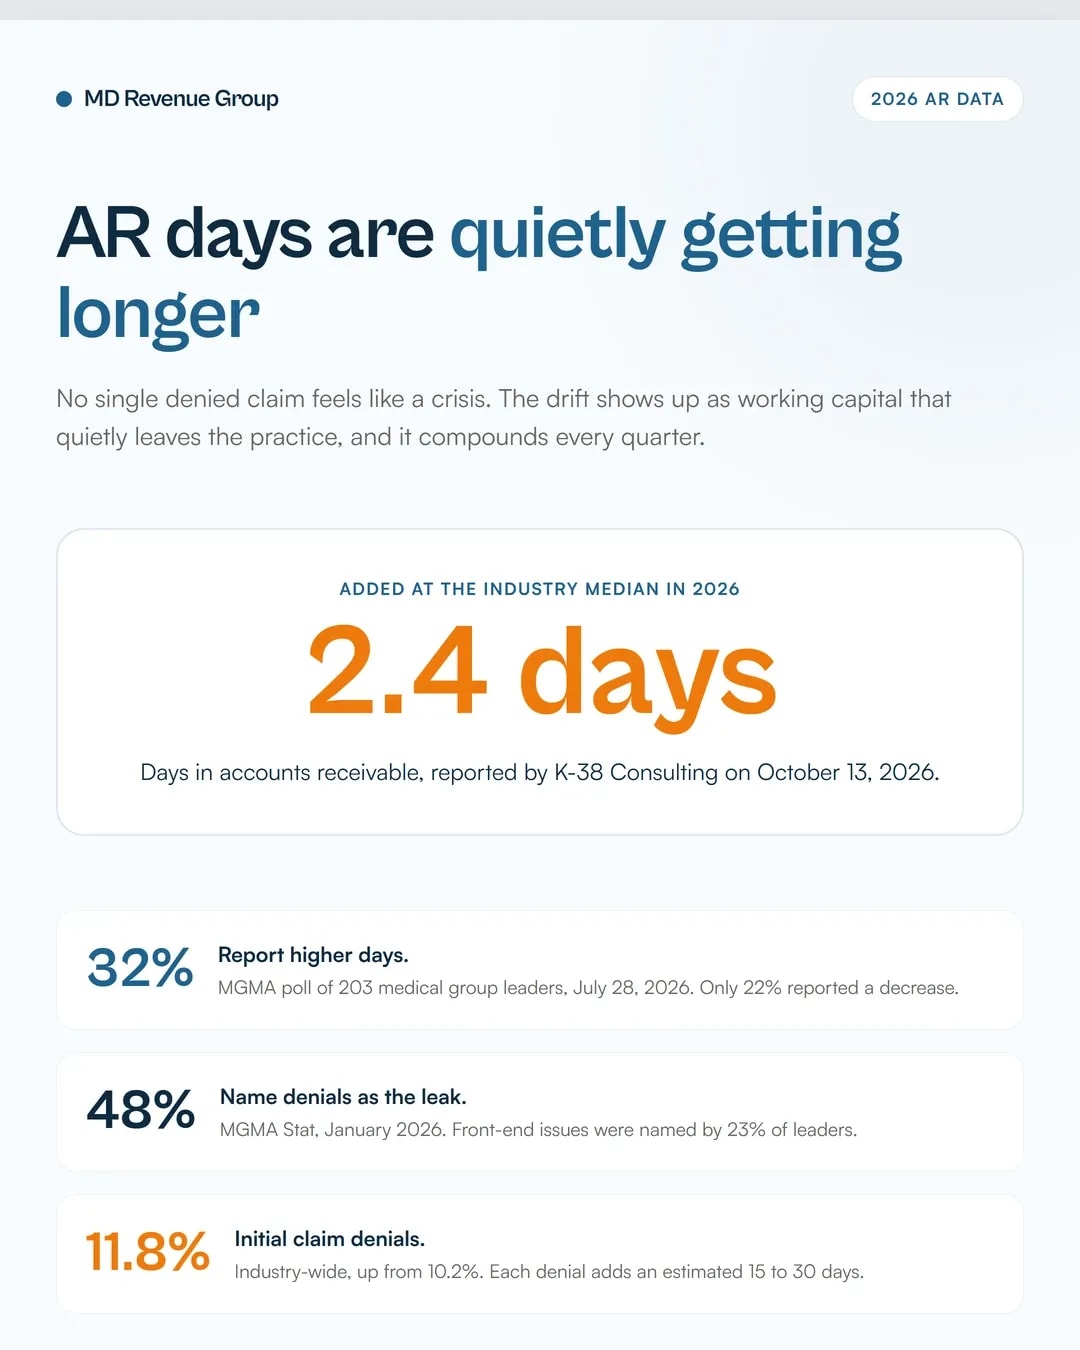
Days in AR trended up by 2.4 days at the industry-wide median in 2026, according to K-38 Consulting, an outsourced CFO firm in Raleigh that cited industry data in an October 13 press release. That is one consultancy's number, and it is worth treating as such.
The corroboration is independent. In a July 28, 2026 MGMA Stat poll of 203 medical group leaders, 43% said their days in AR were about the same as a year earlier, 32% said higher, 22% said lower, and 3% were unsure. MGMA's own read: the results do not point to broad improvement.
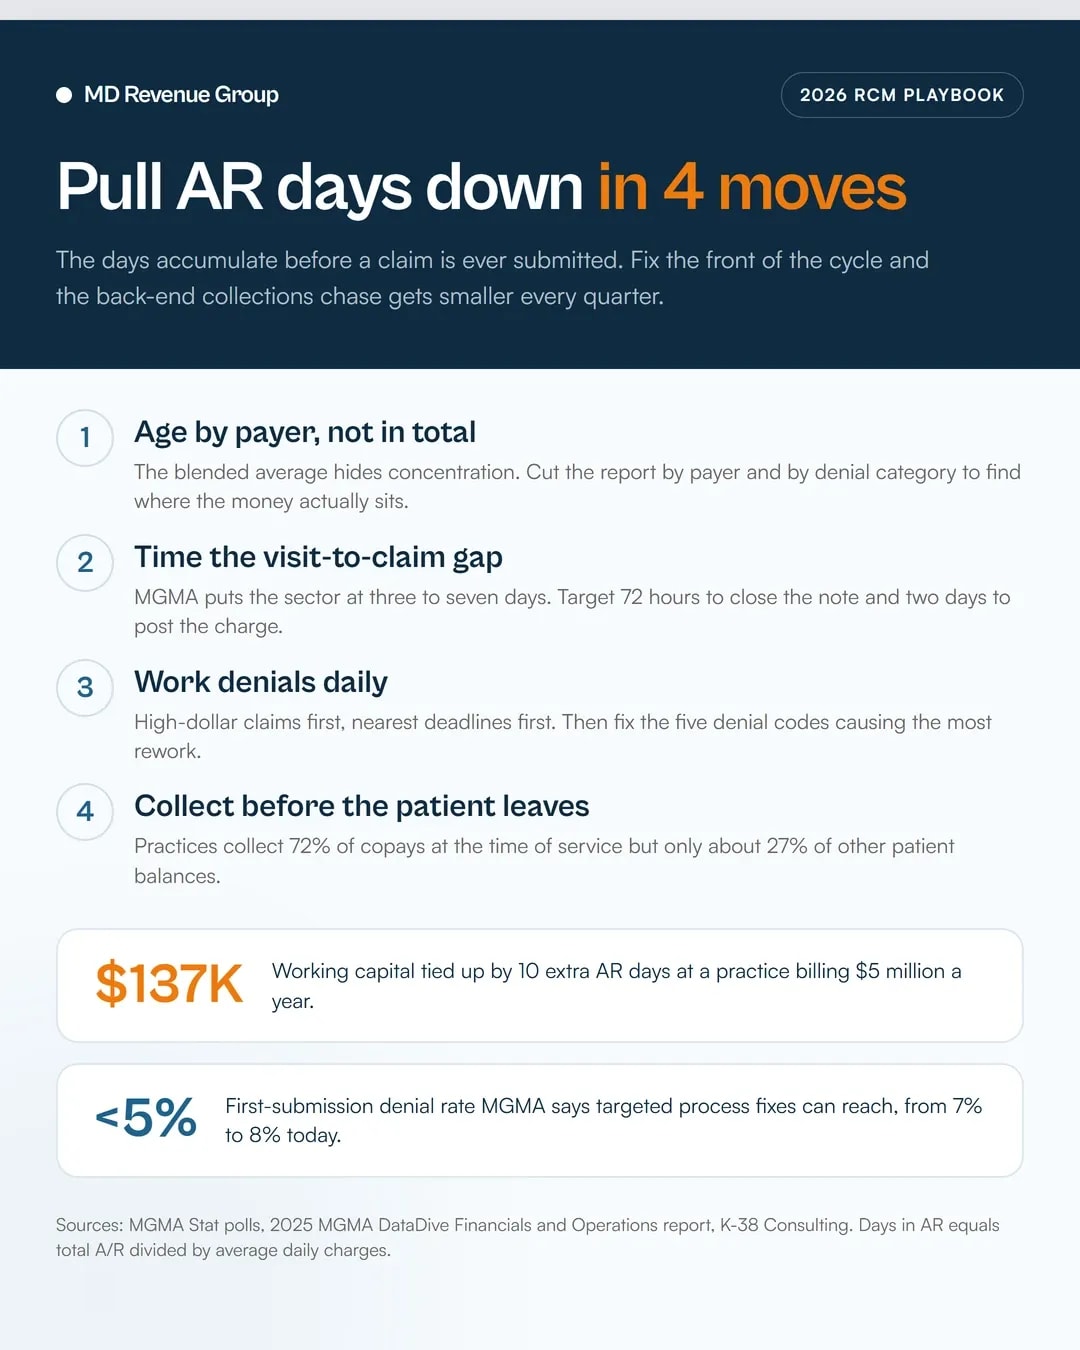
Two days sounds small. A practice billing $5 million a year bills about $13,700 a day, so a 10-day increase ties up roughly $137,000. Here are the benchmarks that are actually traceable, the math at four practice sizes, and where the days are hiding in your aging report right now.
Key takeaways
- Days in AR rose 2.4 days at the industry-wide median in 2026, driven by Medicare Advantage prior authorization backlogs and claims pending medical record review (K-38 Consulting, October 13, 2026).
- MGMA's own July 2026 poll of 203 leaders found 32% reporting higher days in AR and only 22% reporting a decrease.
- The only freely published target range comes from AAFP: days in AR should stay below 50 days at minimum, with 30 to 40 preferable. MGMA collects medians but publishes them inside licensed products.
- A practice billing $5 million a year bills about $13,700 per day, so 10 AR days is about $137,000 of working capital.
- 48% of medical group leaders named denials and appeals as their largest source of revenue leakage, against 23% who cited front-end issues (MGMA Stat, January 6, 2026).
Are AR days really rising?
Two independent sources say yes, and they disagree about how dramatic it is.
K-38 Consulting, a Raleigh firm that sells outsourced CFO services to practices and startups, reported on October 13, 2026 that days in accounts receivable trended up by 2.4 days at the industry-wide median in 2026. It attributed the move to Medicare Advantage prior authorization backlogs and claims pending medical record review, alongside climbing claim denial rates and increased payer reviews (press release carried by East MN Weekly News).
Same release, more detail. Initial claim denial rates reached 11.8% industry-wide, up from 10.2% a few years earlier, and each denied claim adds an estimated 15 to 30 days to the accounts receivable cycle because of rework, resubmission and payer review. Cardiology, orthopedics and oncology practices absorbed a disproportionate share of the 2026 increase, which K-38 attributes to payers deploying AI-driven audit tools at greater scale.
Read that as one firm's read of its own client base. It is a useful signal, and it is not a benchmark.
MGMA's poll is the harder number. Chris Harrop reported on July 30, 2026 that 43% of 203 medical group leaders said days in AR were about the same as a year ago, 32% said higher, 22% said lower and 3% were unsure (MGMA Stat). MGMA's own framing matters: 43% holding steady and nearly one-third moving backward does not point to broad improvement. It points to revenue cycle teams working harder to stand still.
The same MGMA article explains why holding steady still takes work. Leaders whose days in AR rose cited slower payment, initial denials, downcoding, requests for medical records, prepayment audits and lengthy appeals. Meanwhile, in a June 30 poll, 47% of groups reported revenue up and 36% down, so the cash pressure is real for a large share of practices regardless of the AR number.
What the published benchmarks actually say
Every practice manager can quote a days in AR target. Far fewer can say where it came from. Here is what is traceable.
Source | What it says | What to know before you use it |
|---|---|---|
AAFP | Days in A/R should stay below 50 days at minimum, with 30 to 40 preferable (AAFP practice finances) | The only freely published target range. Practice-management guidance for family medicine, with no stated sample or denominator behind it |
MGMA, as attributed by K-38 | Healthy days in AR under 40 days, top performers at 30 to 35 days, most practices carrying 35 to 55 days | MGMA collects medians but publishes them inside licensed DataDive products. The under-40 and 30-to-35 figures are the most widely repeated AR numbers in the industry and cannot be traced to a public MGMA page |
MGMA DataDive definitions | Days of gross fee-for-service charges in A/R equals total A/R divided by gross FFS charges times 1/365. A second version uses adjusted FFS charges (MGMA A/R, collections and payer mix) | Two legitimate versions produce two different numbers from the same practice. Say which one you use every time you report it |
MGMA Stat, July 2026 | 32% of 203 leaders reported higher days in AR, 22% lower | Direction, not a target. Useful as a trend signal, useless as a number to hit |
K-38 Consulting | Most practices now carry 35 to 55 days, with the gap between average and top performers widening | A press release from a firm selling CFO services to practices. Treat as one data point, not an industry standard |
So what number should you target? Use AAFP's range as your floor and your own trailing trend as your real benchmark. A practice at 38 days and falling is healthier than a practice at 34 days and climbing.
One more detail worth knowing. MGMA's formula divides by charges, not by revenue, so a practice with a heavy self-pay mix will look worse on this metric than a practice with the same cash position and fewer patient balances. That is why MGMA's own poll contains this response: one practice kept insurance A/R within 28 days, but self-pay balances raised its overall result to 32 days.
The working-capital math
Days in AR is a cash metric dressed as an efficiency metric. Multiply your annual charges by 1/365 to get your daily charges, then multiply that by the number of days you want to remove or add.
Annual billing volume | Daily charges | 5 extra days | 10 extra days | 15 extra days |
|---|---|---|---|---|
$1,000,000 | $2,740 | $13,700 | $27,400 | $41,100 |
$3,000,000 | $8,220 | $41,100 | $82,200 | $123,300 |
$5,000,000 | $13,700 | $68,500 | $137,000 | $205,500 |
$10,000,000 | $27,400 | $137,000 | $274,000 | $411,000 |
The $5 million, 10-day cell is not my arithmetic. K-38 put the same figure in its release: a practice billing $5 million annually frees roughly $137,000 in working capital for every 10-day reduction in AR days, and a 10-day increase ties up the same amount.
Now apply the industry's 2.4-day move to the same table.
Annual billing volume | What 2.4 days costs you |
|---|---|
$1,000,000 | about $6,600 |
$3,000,000 | about $19,700 |
$5,000,000 | about $32,900 |
$10,000,000 | about $65,800 |
That is the quiet part of this story. Nobody loses a customer over a 2.4-day drift. It shows up as the loan you cannot renew, the hire you delay, or the vendor you stop paying on time.
A caution on the math. This uses annual charges as the denominator, which is the MGMA gross version. If your practice calculates on adjusted charges or on a trailing quarter, your own numbers will be lower and your trend will still be valid. Pick one formula and keep it.
Why the days are getting longer
Denials, then prior authorization, then the review layer.
MGMA's January 6, 2026 poll found 48% of medical group leaders named denials and appeals as their practice's largest source of revenue leakage, against 23% who cited front-end issues. Each denied claim restarts the collection clock and pushes the balance into an older aging bucket. MGMA benchmarking puts first-submission denial rates at 7% to 8% across the past four years, and its 2025 Financials and Operations report says targeted process fixes can push that below 5%.
K-38's numbers point the same way from the other end: 11.8% initial denial industry-wide, and 15 to 30 days added per denial.
Revenue cycle leaders see it as the defining problem of 2026. Adonis polled more than 120 RCM leaders across 18 specialties for its 2026 State of RCM report and found that 62% cited denials and managing underpayments as a top obstacle, with payer behavior overtaking internal challenges such as staffing as the largest risk to revenue growth (Fierce Healthcare). Most organizations in that survey spend between 51 and 75 hours a week on denial work. And 47% said they lost between 3% and 4% of net patient revenue to denied claims, underpayments or timely filing limits.
Medicare Advantage prior authorization is its own drag. K-38 names MA auth backlogs as a primary driver of the 2026 increase. Federal prompt-pay rules set a floor that many plans are slow to hit: under 42 CFR 422.520, an MA organization must pay 95% of clean claims within 30 days of receipt, pay interest on clean claims that miss that window, and pay or deny other claims from non-contracted providers within 60 calendar days (eCFR). A practice billing MA volume waits on that clock, and interest is a remedy you have to ask for.
Then there is the review layer. K-38 names claims pending medical record review as a second driver, and MGMA's poll respondents named medical record requests and prepayment audits among the reasons their days rose. Cardiology, orthopedics and oncology absorbed the largest share of the increase, which K-38 ties to payers scaling up AI-driven audit tools.
Practice-side problems sit underneath all of it. MGMA poll respondents reported vacancies and difficulty replacing experienced A/R staff, credentialing delays for new providers, and interruptions from changing billing companies, EHRs or practice management systems. One system transition reportedly delayed billing for two months because of interface problems. That last one has nothing to do with a payer.
Four places your AR days hide
The average is hiding a concentration problem
A practice can sit at 38 days, comfortably inside the AAFP range, and still have a quarter of its money past 90 days. K-38 makes the point with a concrete example: a practice with a 38-day AR average can still have 25% of total receivables sitting past 90 days if that aging sits in a small number of high-dollar claims.
The headline number tells you there is a problem. An aging report broken out by payer and denial category tells you where to push.
Patient balances are dragging the average, not payers
In 2024, practices collected 72% of copayments at the time of service but only about 27% of other patient-due balances, according to MGMA. Everything uncollected at check-in moves to statements, calls, and eventually old A/R. Our medical billing denial management guide covers the workflow side; the check-in conversation is where this one gets fixed.
Your charge-to-submit lag is larger than you think
MGMA puts the sector's lag between the visit and a submitted claim at three to seven days. MGMA's own recommendation: set the expectation that clinicians close encounters within 72 hours and staff post charges within two days. That lag sits in front of days in AR rather than inside it, which is exactly why practices miss it. Track it as its own number.
Ownership structure predicts which way the aging moves
The 2025 MGMA DataDive Financials and Operations report shows the split. In 2024, physician-owned practices increased the share of A/R in the 0-to-30-day bucket by roughly 2 to nearly 7 percentage points and kept balances 120 days or older mostly flat. Hospital- and IDS-owned groups moved the other way: their 0-to-30-day share fell by double digits while the 120-plus-day share rose between 9.5 and 15.9 points.
The cost showed up in bad debt. Hospital-owned groups reported $43,073 per FTE physician in nonsurgical specialties and $48,337 in surgical specialties. Bad debt declined over five years in independent practices.
If you are independent, that is a reason to stay independent. If you are hospital-owned or in a management services company arrangement, that is your specific problem to fix.
The playbook for pulling AR days down
1. Run the aging by payer before you run it in total
MGMA's first recommendation is the cheapest one. Break A/R out by payer so you can name which ones are slow before contract season. Then add a second cut by denial category. Our accounts receivable resource hub covers the aging report structure, and how to reduce claim denials covers the denial categories you need to sort into it.
2. Measure time from visit to submitted claim
Set two internal targets: notes closed within 72 hours, charges posted within two days. Run the actual number monthly. If it is sitting at seven days, you have five days of AR to remove before you touch anything else.
3. Work denials daily, highest dollar first
MGMA recommends starting with high-dollar claims and the nearest appeal deadlines, then reviewing the five most common denial codes for preventable causes. Prevention is the compounding part. A 7% to 8% first-submission denial rate that moves to 5% removes rework cycles you are paying interest on today.
4. Collect patient balances before the patient leaves
Give front-desk staff a standard script for explaining estimates and asking for the patient portion before the visit ends. MGMA's October 21, 2025 poll found 66% of groups holding or improving patient balance collections, with clearer estimates, stronger time-of-service collection and staff accountability cited most often. Small practices doing this cold can see our small practice medical billing guide for the staffing side.
5. Benchmark against your specialty and track your own trend monthly
Days in AR vary by payer mix and authorization burden, so a single industry number will not tell you whether you are doing well. Run your own number on the same day each month, using a rolling three-month average of daily charges so seasonal swings do not fool you. Then read it next to your clean claim rate benchmark and your denial rate. A practice can look acceptable on days in AR while writing off denials it never worked.
6. Take the payer-level aging into contract talks
This is the step practices skip. If one payer is 18 days behind the others and holds $200,000 of your receivables, that is a contract data point, not a billing problem. Payer aging reports show which payers are consistently slow, how much A/R is tied up, and how long you have been waiting. If you want that built on your data, our revenue cycle management team produces it monthly.
One result to keep in mind when you set expectations. MGMA's poll respondents who cut days in AR described deliberate operational changes rather than one fix: adding staff, new billing leadership, stronger denial management, closing notes sooner, better registration and collections. One respondent reported an RCM overhaul that took days in AR from 67 to under 34.
Get your real days in AR measured
Most practices cannot answer a simple question: what is our days in AR, on which formula, split by payer? We pull your last 12 months of A/R, recalculate on the MGMA adjusted-charges basis, split the aging by payer and denial category, and show you the working-capital number behind the trend. Request a free audit and we'll run it.
Frequently asked questions
The only freely published target range comes from the American Academy of Family Physicians: days in A/R should stay below 50 days at minimum, with 30 to 40 days preferable. That is practice-management guidance, not a measured median, and AAFP states no sample behind it. MGMA collects observed medians but publishes them inside licensed DataDive products. Your own trailing trend is the more useful benchmark.
MGMA's version divides total accounts receivable by gross or adjusted fee-for-service charges, multiplied by 1/365. Adjusted charges subtract payer contractual adjustments. A second common version, used by HFMA as net days in A/R, divides net A/R by average daily net patient revenue over the trailing three months. The same practice can report 33 days on one and 60 on the other. Pick one and state which.
Divide annual billing volume by 365. A practice billing $1 million a day bills about $2,740 per day, $5 million bills about $13,700 per day, and $10 million bills about $27,400 per day. Each of those is the cash tied up per AR day, which is why a 10-day drift at $5 million is roughly $137,000.
Denials and prior authorization lead the list. MGMA's January 2026 poll found 48% of leaders named denials and appeals as their largest revenue leak. K-38 Consulting reported initial denial rates at 11.8% industry-wide, with each denial adding an estimated 15 to 30 days. Medicare Advantage prior authorization backlogs and claims pending medical record review were the other two drivers K-38 named.
Only after you check the front end. MGMA's poll respondents who improved cited closing notes sooner, better registration and stronger denial management alongside added headcount. Practices running the metric above 50 days usually have a charge-to-submit lag problem and an unworked denial backlog before they have a staffing problem. Fix the front, then staff the back.
Get your AR aging report rebuilt
The 2.4-day drift is real and it is small enough that most practices will absorb it without noticing. The practices that notice are the ones that rebuilt their aging report by payer, started working denials daily, and turned their charge-to-submit lag into a tracked number. We will pull your data, run the math on your volume, and show you exactly where the days are sitting. Request a free audit and we'll put it on your service mix.