
Revenue Cycle Management: The Complete Guide for Practices
Revenue cycle management explained with 2026 benchmarks: days in A/R, denial rates, cost to collect, and where the money leaks at every stage.
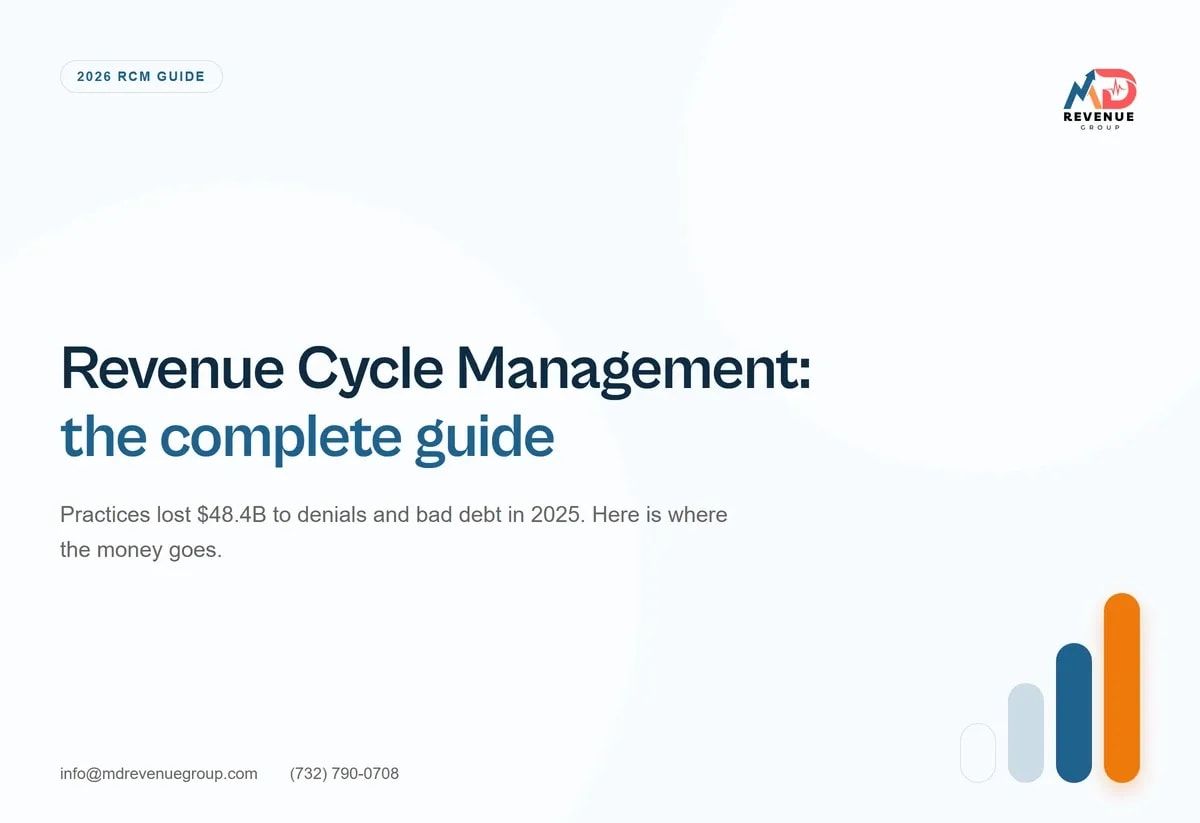
Revenue cycle management (RCM) is the work of getting every dollar your practice bills paid: registration, eligibility verification, prior authorization, charge capture, coding, claim submission, payment posting, denial appeals, and patient collections. HFMA defines it as the process used to track revenue from a patient's first appointment to their final payment of balance.
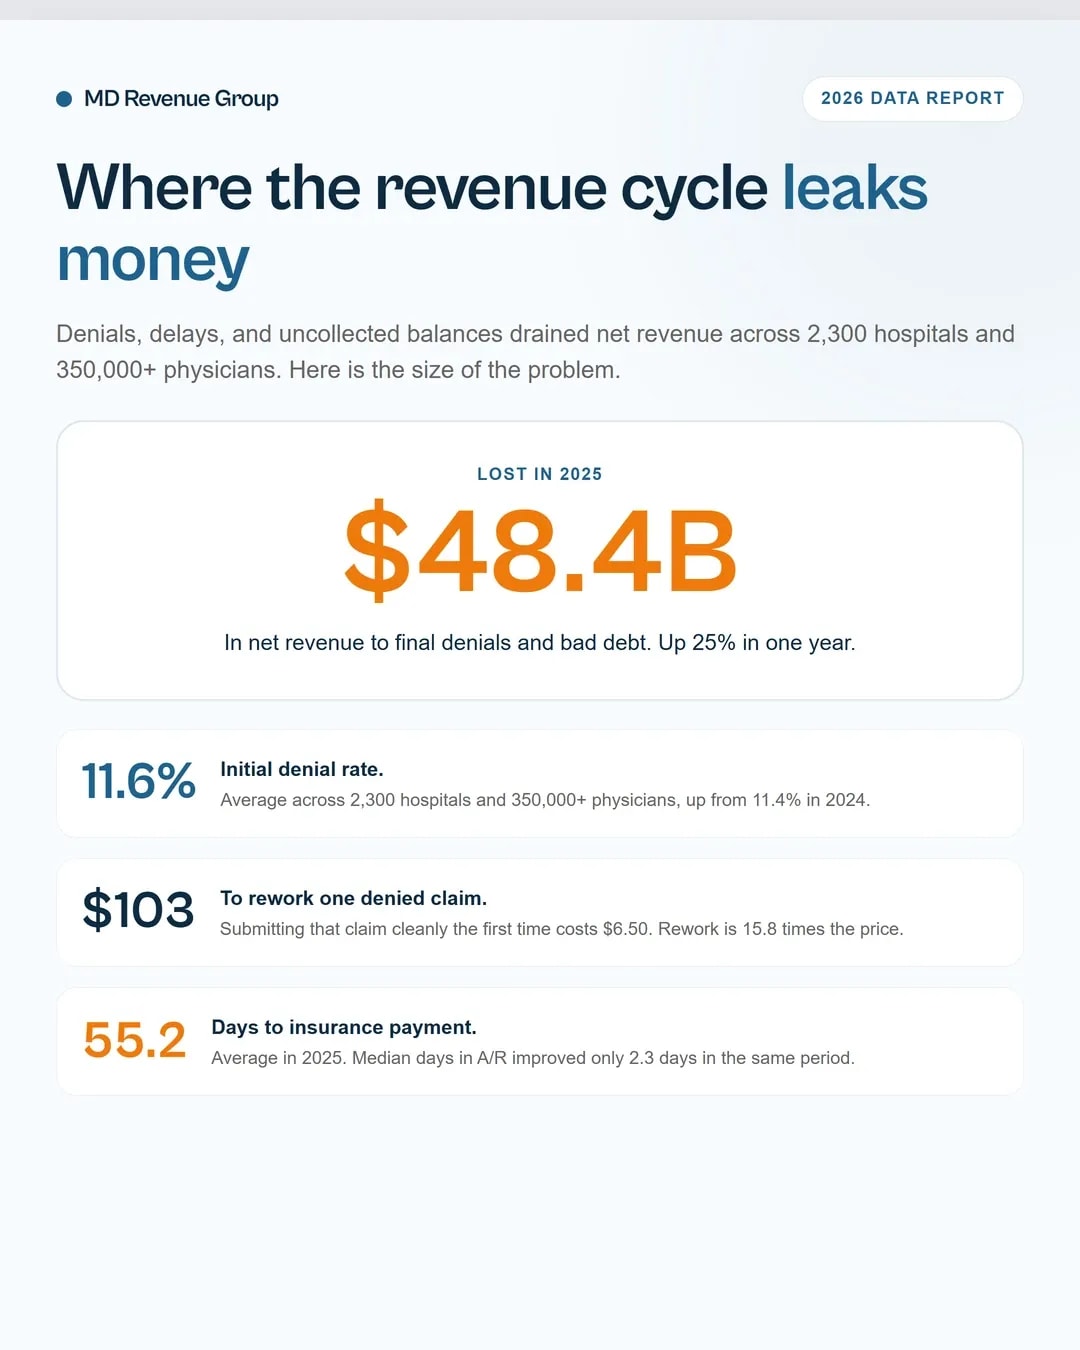
Here is where practices actually stand in 2026. Kodiak Solutions, benchmarking 2,300 hospitals and more than 350,000 physicians, put average time to insurance payment at 55.2 days in 2025 and counted $48.4 billion in net revenue lost to final denials and bad debt. That is up 25% from $38.6 billion in 2024. The average initial denial rate was 11.6%.
This guide covers what each stage of the revenue cycle involves, the 2026 benchmarks that tell you whether yours is healthy, where the money leaks, and the four numbers that decide between fixing revenue cycle management in-house and outsourcing it.
Key takeaways
- Average time to insurance payment was 55.2 days in 2025, and providers lost $48.4 billion to final denials and bad debt.
- Initial denial rate: 11.6% in 2025, per Kodiak Solutions.
- Reworking a denied claim costs $103. Submitting it cleanly the first time costs $6.50.
- Medicare Advantage is the payer gaining share (10.3% to 13.0% of emergency department encounters since 2022), and it pays in 30 to 45 days against 10 to 14 days for traditional Medicare.
- HFMA's target for days in A/R is 30 to 40 days, with under 10% of A/R older than 90 days.
What revenue cycle management covers
HFMA splits the revenue cycle into 3 phases with 21 steps. Phase one is the engaged consumer: scheduling, pre-registration, insurance verification, authorization, price estimation, financial counseling, and cashiering. Phase two is the engaged patient: arrival, validation, financial clearance, care delivery, clinical documentation, and referral management. Phase three is account resolution: claim processing, denial handling, payer payment analysis, third-party follow-up, customer service, self-pay collection, and collection agency work.
35 days in AR is the benchmark. Anything over 50 is uncollected revenue.
We conduct a forensic 90-day cash flow audit to identify unworked claims, fee schedule underpayments, and clearinghouse leaks.
Audit My Cash Flow Leaks →If you want the plain-language version of the front office half, start with what is medical billing.
MDRG's revenue cycle management service runs all 21 steps for practices that don't want to staff every one of them in-house.
About 40% of claims are already zero-touch, meaning they pay with no human touch at all. Every remaining touch costs somewhere between $2.50 and $8 in direct labor.
The 2026 benchmarks for a healthy revenue cycle
Here is the reference table. These are the numbers to check yourself against, with the source named.
Metric | Benchmark | Source |
|---|---|---|
Days in A/R | 30 to 40 days | HFMA |
A/R over 90 days | Under 10% of total | HFMA |
Self-pay A/R over 90 days | Under 30% | HFMA |
Net collection rate | 95% minimum, 97% to 99% optimal | HFMA |
Clean claim rate | 98% | HFMA |
Denial rate | 5% to 10%, under 5% optimal | HFMA |
Denial resolution | 85% of denials resolved within 30 days | HFMA |
Charge capture | Complete charges captured within 3 to 5 days of service | HFMA |
Late charges | 2% of total charges or less | HFMA |
Days to bill a charge | 2 days or less | Peer-reviewed RCM review |
Clean claims ratio | 95% or more | Peer-reviewed RCM review |
Days to pay | Private insurance 12 to 20 days, Medicare 18 to 30 days, workers' compensation 55 to 75 days | Peer-reviewed RCM review |
One caution before you copy these. No authoritative public source publishes a median days in A/R figure. MGMA's real medians sit behind a member login. The American Billing Association calls 42 days the industry average in its 2026 benchmark, with the top quartile at 28 and the top 10% at 18. For contrast, the physician practice winners of HFMA's 2024 MAP Award posted a median of 21.9 net days in A/R. How days in A/R benchmarks are actually calculated shows why your number won't match anyone else's.
State rules move the target. Filing deadlines, prompt-pay statutes, and appeal windows all differ by state, so a national benchmark can be wrong on the ground. Our medical billing services in New Jersey page covers the specifics there.
Every state has its own collection deadlines and appeal windows. All state pages list them.
Days in A/R is the number most leaders quote and few can explain.
Why days in A/R stopped improving
Practices spent the last five years buying software, hiring, and retraining. Days in A/R barely moved. Kodiak's data show median days in A/R improving only 2.3 days from 2024 to 2025, while average time to insurance payment went from 57.4 days to 55.2.
The reason sits in the payer mix. Epic Research, working from more than 550 million encounters, found that in the emergency department, self-pay and Medicare Advantage were the only two coverage types to grow between 2022 and 2026. Medicare Advantage rose from 10.3% to 13.0% of encounters. Traditional Medicare fell from 12.8% to 11.9%, Medicaid from 18.2% to 16.1%, and commercial from 53.1% to 51.3%. Medicaid fell in all four settings Epic studied.
MA also pays slower. MGMA reports Medicare Advantage plans take 30 to 45 days to pay a clean claim, against 10 to 14 days for traditional Medicare. Kodiak's 2025 data show MA initial and final denial rates at more than double traditional Medicare, and the AHA's Costs of Caring 2026 report found MA plans deny about 17% of initial claims.
And there is no federal prompt-pay standard for in-network MA claims. The Medicare Advantage Prompt Pay Act (H.R. 5454) would require plans to pay 95% of clean claims within 14 days. It is a bill, not law. The AHA documented the gap in May 2026 and found that 50% of the 772 hospitals it surveyed carry more than $100 million in unpaid claims older than six months.
Every 1% of your book that moves from traditional Medicare to Medicare Advantage adds about 0.26 days to blended A/R. Shift 5% and you add a day and a quarter without touching a single workflow.
That's an MDRG calculation. MGMA's payment windows put the gap between the two payers at 25.5 days.
What denial prevention is worth
HFMA's Fall 2025 numbers are the ones to keep next to each other. The national average cost to rework a denied claim is $103. The national average cost to submit the initial claim is $6.50. Rework costs 15.8 times as much as doing it right.
Kodiak's numbers explain why this matters. $48.4 billion in net revenue was lost in 2025 to final denials and bad debt. The median final denial rate rose from 2.5% to 2.7%. Only 42.1% of appealed denials were overturned, down from 42.7%.
The leak concentrates in two places. MGMA polled 288 practice leaders in January 2026 about where revenue escapes the cycle. Denials and appeals accounted for 48%. Front-end issues were 23%. Billing and collections were 14%. Coding was 13%. Charge posting was 2%.
48% of the leak is denials and appeals, which is where the 85% resolved within 30 days rule does the most work.
Experian Health's 2025 survey of 250 revenue cycle leaders explains the front-end half of that 23%. 26% said 10% of their denials came from inaccurate or incomplete data collected at patient intake. How to reduce claim denials covers the workflow side of that number.
We also run medical billing audits that find where a specific practice's leak starts.
Which parts of the cycle to automate first
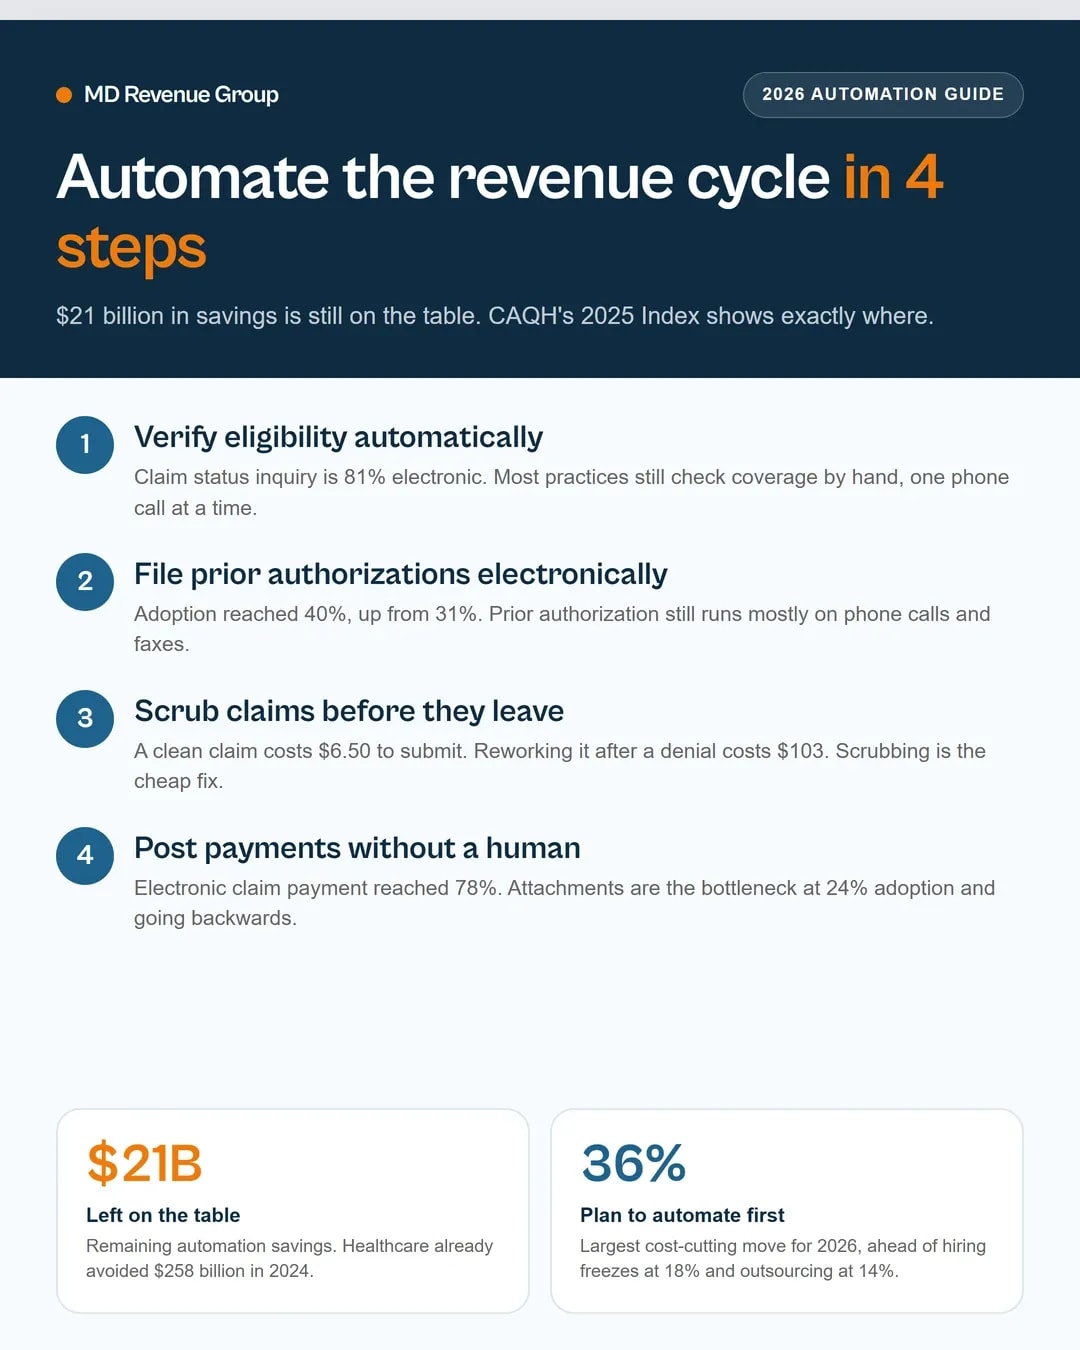
CAQH's 2025 Index covers more than 600 provider organizations and health plans representing 63% of insured lives. Healthcare avoided $258 billion in administrative costs in 2024 through electronic transactions, and $21 billion in savings is still sitting there.
Adoption is uneven.
Transaction | Electronic adoption | Direction |
|---|---|---|
Claim status inquiry | 81% | Up from 74% in the 2023 Index |
Claim payment | 78% | Up from 73% |
Electronic prior authorization | 40% | Up from 31% |
Attachments | 24% | Down from 32% |
Attachments are the row worth staring at. Sending records to payers is the hardest transaction to automate, and adoption went backwards, from 32% in 2024 to 24% in 2025. CAQH puts the industry's 2024 administrative spend at $82 billion, with $258 billion already avoided through electronic transactions.
Practice leaders agree on where to start. MGMA polled 226 practice leaders in January 2026 about their biggest 2026 cost-cutting move. Automation took 36%, process fixes 23%, hiring freezes 18%, outsourcing 14%, and new vendors 9%. More than 8 in 10 were looking for fixes beyond staffing cuts.
Black Book Research's 2026 evaluation of 49 RCM categories found 73% of hospitals already run automation in at least one workflow, 76% linking front-end data quality to denials or cash timing, and 71% naming prior authorization a top-three operational bottleneck.
Adding tech without removing a step adds cost. MGMA's own warning to practices planning an automation year.
The KPIs to track every month
HFMA publishes 29 MAP Keys, industry-standard revenue cycle metrics grouped into patient access, pre-billing, claims, account resolution, and financial management. Most practices track 6 of them.
Here is the short list that changes decisions.
KPI | What it tells you | Target |
|---|---|---|
CL-1 Clean claim rate | Share of claims passing edits with no human intervention | 98% |
FM-1 Net days in accounts receivable | Net A/R against average daily net revenue | 30 to 40 days |
AR-1 Aged A/R buckets | Where the balance is sitting | Under 10% over 90 days |
PB-4 Total charge lag days | How long charges sit before posting | 2 days or less |
Denial resolution rate | Whether the appeal queue is working | 85% in 30 days |
Net collection rate | What you collect of what's allowed | 95%+ |
Cost to collect | Revenue spent per dollar collected | Track your own number |
The last row needs attention because published sources don't agree. HFMA's best-practice figure is 2% of cash collected, and its MAP Key FM-6 defines cost to collect as total revenue cycle cost divided by total patient service cash collected. Vendor surveys land at 3% to 4%. The American Billing Association's 2026 benchmark puts the industry average at 9.4%, the top quartile at 5.8%, and the top 10% at 3% to 4%.
The spread comes from measurement definitions. A cost to collect computed against gross charges produces a different number than one computed against cash collected. Pick one definition, write it down, and track it monthly.
In-house or outsourced: how to decide
97% of healthcare organizations outsource at least one revenue cycle function, and 70% plan to expand, according to Becker's Healthcare and Savista's 2025 RCM benchmark survey. AAPC found 63% of providers report staffing gaps in their RCM departments. MGMA's May 2026 poll of 303 practice leaders found 28% reported higher staff turnover than 2025, with churn concentrated in medical assistants, front desk and patient access, and revenue cycle roles.
Staffing is the constraint. Here's the decision table.
Your situation | Call | Why |
|---|---|---|
Fewer than 3 providers, no dedicated billing staff | Outsource | Scale and specialization cost more than the fee |
3 to 10 providers, 1 to 2 billers | Hybrid | Keep eligibility and denials in-house, outsource coding and A/R |
10+ providers with a full RCM team | In-house with tools | Automation spend beats per-claim fees at volume |
Denials above 10% of volume | Audit first, then decide | Fix the process before changing who runs it |
Days in A/R above 45 | Audit first, then decide | You have a workflow problem, not a staffing problem |
MGMA's 2026 poll on cost cutting has 14% of practices planning to outsource this year. The same piece warns that outsourcing fails when governance is weak, so keep the work you must own.
A side-by-side of in-house and outsourced billing walks the decision with cost math.
Our pricing shows what outsourced revenue cycle management costs.
Frequently asked questions
What is revenue cycle management? The process of tracking and collecting revenue from a patient's first appointment to final payment of balance. It covers registration, eligibility, authorization, charge capture, coding, claim submission, payment posting, denials, and patient collections.
How many stages are in the revenue cycle? Depends who you ask. HFMA's patient-centric model has 21 steps in 3 phases. Most vendors describe 7 stages, some describe 8, and some describe 12. We map them in the 7 revenue cycle stages.
What is a good days in A/R benchmark? HFMA says 30 to 40 days with under 10% of A/R older than 90 days. The American Billing Association's 2026 benchmark puts the industry average at 42 days, the top quartile at 28, and the top 10% at 18. The physician practice winners of HFMA's 2024 MAP Award posted a median of 21.9 net days in A/R.
How much does a claim denial cost? $103 to rework a denied claim, per HFMA's Fall 2025 data. Submitting the claim cleanly the first time costs $6.50.
Is revenue cycle management worth outsourcing? Usually when the practice is small, staffing is thin, or denial rates are high. Our revenue integrity tool scores your current cycle so the decision runs on your numbers instead of a vendor's pitch.
See what your revenue cycle is actually costing you
Most practices don't know their denial rate, their clean claim rate, or their real days in A/R. We pull all three from your existing data and show you where the money sits. Request a free revenue audit.
See your revenue leaks in dollars.
Get a forensic 90-day cash flow audit of your practice. 100% confidential, 48-hour delivery, zero obligation.