
Medical Billing Process Steps: 7 Stages From Registration to Payment
The 7 medical billing process steps, with 2026 benchmarks from MGMA, Premier and CAQH. See the time targets, the leaks, and what each stage costs you.
The medical billing process has 7 stages: patient registration, insurance verification, prior authorization, clinical documentation and coding, charge capture, claim submission, and payment posting with denial follow-up. Each stage has an owner, a time target, and a specific way it fails.
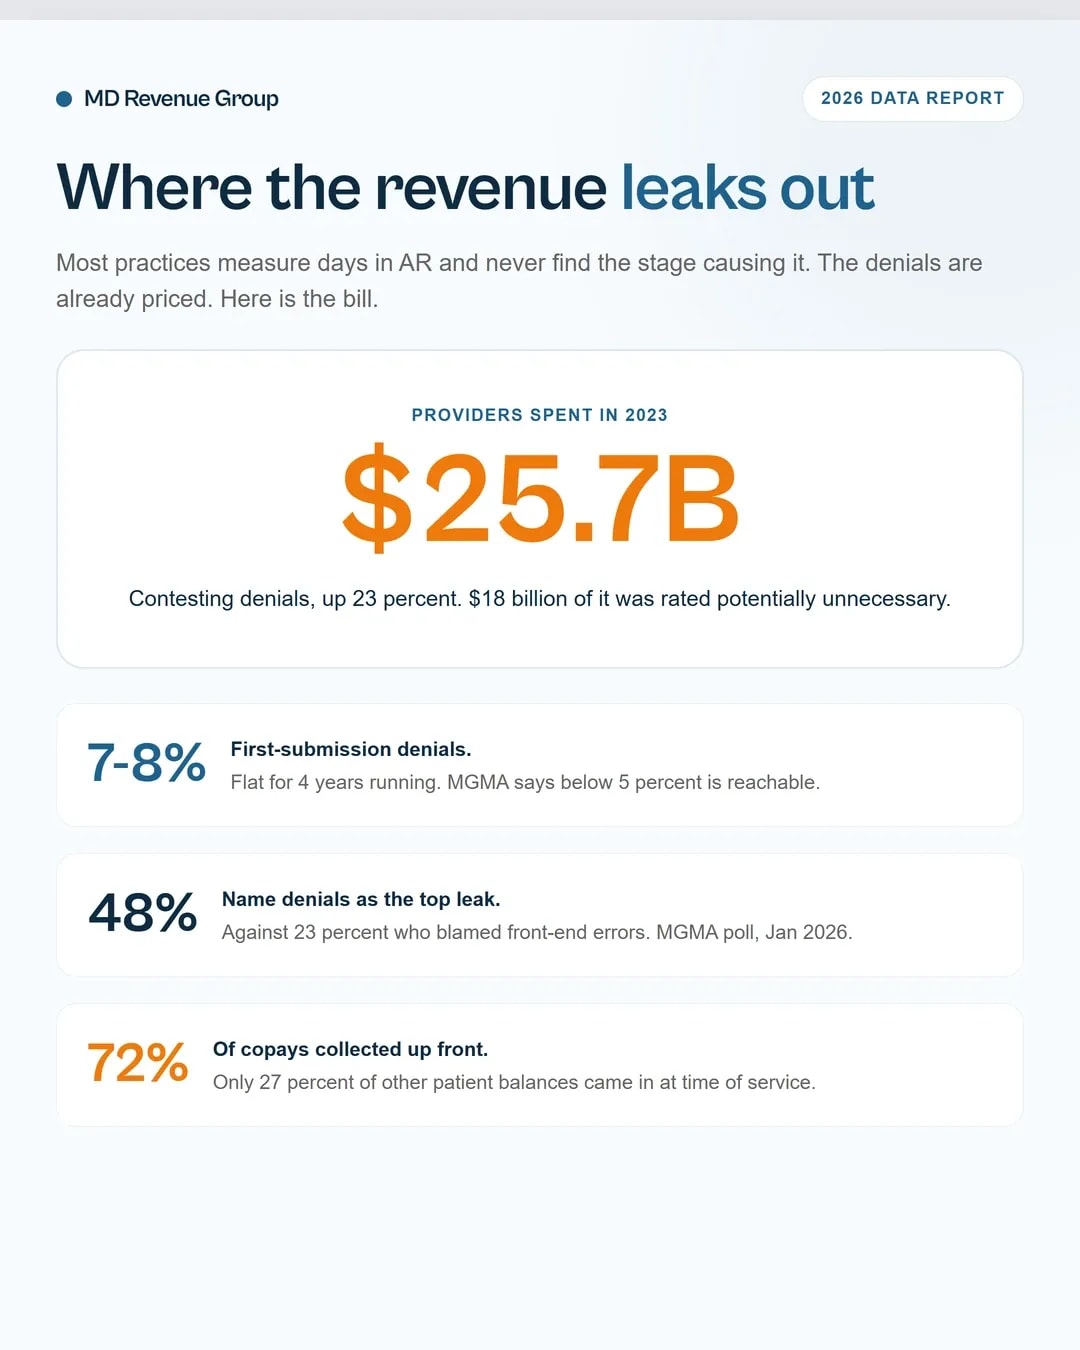
Running the sequence correctly is a revenue decision, not an administrative one. MGMA benchmarking puts first-submission denial rates at 7% to 8% for the 4th straight year. Premier's 2023 survey of 280 member hospitals found providers spent $25.7 billion contesting denials that year, up 23%, with $18 billion of that spend rated potentially preventable.
Below is each stage, the number it gets measured against, and the leak it opens when it stalls.
If you need the foundation first, what is medical billing covers the terminology this guide builds on.
Key takeaways
- MGMA benchmarks first-submission denials at 7% to 8%. Its 2025 DataDive report says practices can reach below 5% with targeted fixes.
- Charge lag runs 3 to 7 days across the sector. MGMA's own recommendation is closing encounters within 72 hours and posting charges within 2 days.
- In 2024, practices collected 72% of copays at the time of service but only 27% of other patient balances.
- Denial rework costs $25 to $118 per claim. Submitting a clean claim that stays clean costs roughly $6.50.
- MGMA's January 2026 poll found 48% of leaders named denials as their largest revenue leak, against 23% who blamed the front end.
What are the 7 stages of the medical billing process?
Every practice runs the same 7 stages. The difference is whether anyone owns the handoff between them.
1. Patient registration. Demographics, subscriber details, member ID, group number, and any secondary coverage, captured before the patient walks in. A misspelled name or a stale member ID here costs you the full claim cycle.
2. Insurance verification. Coverage active on the date of service, network status, copay, remaining deductible, visit limits, and whether authorization is required. Skipping this stage is what produces the eligibility denials that surface weeks later, and audit readiness documentation shows what a complete verification record has to contain when someone asks for it.
3. Prior authorization. Payer approval before the service, with the authorization number and valid date window recorded on the encounter. CMS-0057-F set payer response times at 7 calendar days standard and 72 hours expedited under the January 1, 2026 compliance date, so a slow auth response is a payer SLA question, not a practice inevitability.
4. Documentation and coding. The encounter note becomes ICD-10-CM diagnoses and CPT or HCPCS codes. Coding is where the record and the claim have to agree, which is why medical coding resources treat unsupported documentation as the root problem rather than the code selection.
5. Charge capture. Every billable service pulled from the encounter into the practice management system. Miss a flu injection with its administration code and that revenue disappears with no denial to alert you.
6. Claim submission. Scrub, then send. Professional claims go out as the 837P transaction through a clearinghouse. The claims management resource hub covers the submission formats in detail.
7. Payment posting and denial follow-up. Apply the 835 remittance, split payer and patient responsibility, post contractual adjustments, then work every denial before it ages.
How long should each stage take?
Most practices don't know where their days go. They measure days in A/R and argue about whether the number is good enough.
Measure time in stage instead. Here are the targets worth holding:
Stage | Target | What happens when you miss it |
|---|---|---|
Registration to verification | Same day | Ineligible claims go out with no benefit to appeal |
Encounter closed | Within 72 hours | Charge lag compounds daily |
Charges posted | Within 2 days | Work sits in a queue nobody owns |
Claim submitted | Within 5 days of service | Payer clocks start later than yours |
Denial worked | Within 7 days of the 835 | Appeal windows shrink, staff context fades |
Patient balance followed up | Within 30 days of the statement | Balances age out of collectability |
MGMA notes sector-wide charge lag runs 3 to 7 days. One practice leader in MGMA's July 2026 poll reported an RCM overhaul that cut days in A/R from 67 to under 34, attributing it to added staff, stronger denial follow-up, and earlier note closure.
What causes a claim to be rejected before it is denied?
A rejection and a denial are different events with different fixes, and most practices treat them the same way.
A rejection happens at the front door. The claim never reached adjudication. Invalid member ID, wrong NPI, outdated payer ID, code-set mismatch, missing required field. A denial happens after adjudication. The payer reviewed it and said no. Medical necessity, coverage limits, coordination of benefits, timeliness.
Event | Who issues it | When | Fix |
|---|---|---|---|
Clearinghouse rejection | Clearinghouse | Within 24-48 hours | Correct and resubmit, no claim number needed |
277CA reject | Payer | Within days | Correct and resubmit |
Denial | Payer | 14-45 days | Corrected claim, appeal, or write-off |
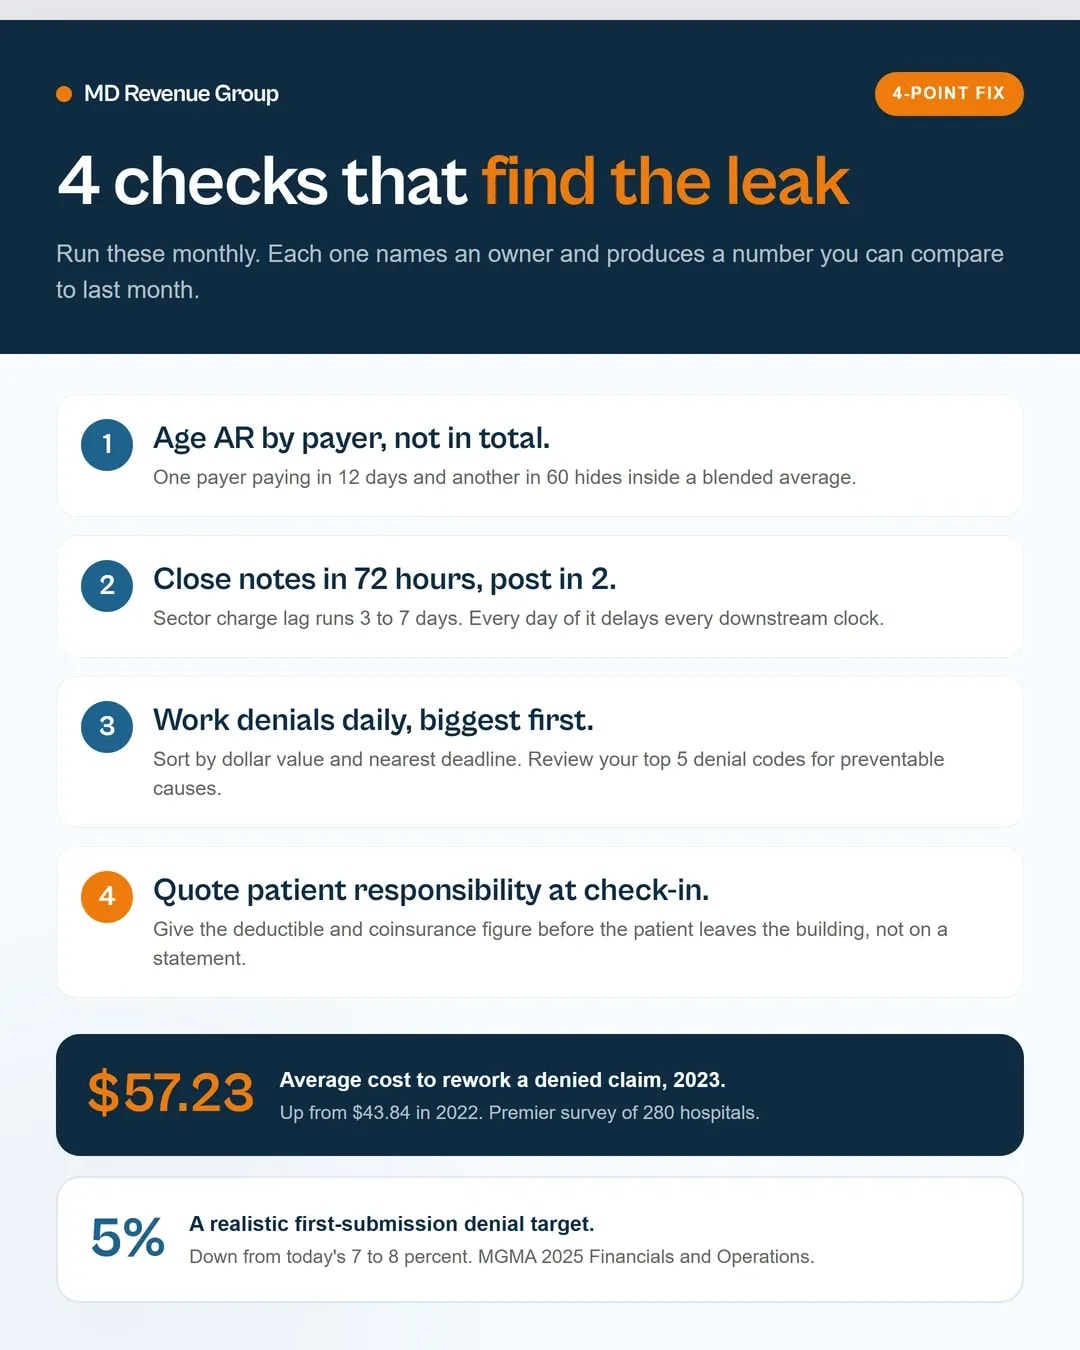
A rejection is cheaper to fix than a denial, but it is not cheap. Premier's 2023 survey put the average administrative cost of reworking a denied claim at $57.23, up from $43.84 in 2022. MGMA's practice-level rework figure sits at the other end, around $25.
At 500 claims a month with a 5% rejection rate, you have 25 rejections before a single claim gets adjudicated. Even at the low end of the range, that is real labor and real delay.
Prevention sits upstream. How to reduce claim denials walks the front-end controls, and medical billing audit services exist to find which control in your operation is actually failing rather than assuming it's the coders.
What does a 3-point denial rate gap actually cost?
Here is the calculation. It's the one number most practice owners have never run.
MGMA says first-submission denials sit at 7% to 8%, and that its 2025 Financials and Operations data shows practices reaching below 5% with targeted process fixes. Take the midpoint of the current range at 7.5% and the achievable target at 5%.
The inputs:
- Annual net patient revenue: $4,000,000
- Average rework cost per denied claim: $25 (MGMA's practice-level administrative figure)
- Current first-submission denial rate: 7.5% (300 denials/year)
- Target first-submission denial rate: 5% (200 denials/year)
The math:
- Denials at 7.5%: 300 × $25 = $7,500/year in rework labor
- Denials at 5%: 200 × $25 = $5,000/year
- Difference: $2,500/year in rework labor alone
Now add the denominator effect. Days in A/R is total A/R divided by average daily charges. Every denied claim restarts the collection clock and pushes the balance into an older aging bucket, where follow-up costs more and write-off odds rise.
The same math with 2 volumes:
Annual revenue | Claims at 7.5% | Claims at 5% | Rework saved |
|---|---|---|---|
$2M | 150 | 100 | $1,250 |
$4M | 300 | 200 | $2,500 |
$10M | 750 | 500 | $6,250 |
The labor saving alone rarely justifies a staffing change. That's the honest version of this calculation, and it's why practices chase A/R days instead.
But factor in what Premier found: providers spent $25.7 billion contesting denials in 2023 and 70% of those denials were ultimately overturned. The money wasn't lost, it was delayed. Every overturn is revenue that arrives 30 to 90 days late and restarts the aging clock.
MGMA's 2024 bad debt data shows hospital-owned groups reporting $43,073 per FTE physician in nonsurgical specialties and $48,337 in surgical specialties. That's what delay turns into when nobody works the queue.
How do you collect patient responsibility before the patient leaves?
MGMA's 2024 numbers expose the gap most practices don't see. Practices collected 72% of copays at the time of service. They collected 27% of other patient-due balances.
Everything beyond the copay slides onto statements, phone calls, and aged A/R. Then it competes with insurance denials for the same staff hours.
Three controls that move the number:
1. Quote the deductible and coinsurance at check-in, not after. The estimate goes in the note before the patient leaves the room: "Deductible remaining is $340. Your estimated coinsurance on a $520 allowed amount is $104. Total due today is $444." A patient who hears a number before the exam accepts it. A patient who hears it on a statement three weeks later disputes it.
2. Take the card before the visit ends. Not in the lobby. Before the patient leaves the building, with the amount already on the printed quote.
3. Re-quote on every visit for a planned course of care. A patient scheduled for 6 sessions has 6 chances to collect at time of service. Most practices collect on the first and then assume the rest.
An Oct. 21, 2025 MGMA poll found 66% of groups holding or improving patient balance collections. The groups that improved most often cited clearer estimates and stronger time-of-service collection.
Patient statements carry their own design rules, and state law matters here. Our medical billing in New Jersey page covers the itemized statement requirement under state law, which is a live compliance exposure for practices serving NJ patients.
Which stage is leaking money in your practice?
Run this diagnostic. Find your dominant symptom, then work the matching stage.
What you're seeing | Most likely stage | What to check first |
|---|---|---|
CO-16 or CO-197 denials | Registration | Member ID validity, subscriber name spelling |
CO-197 on Medicare patients | Verification | Eligibility check actually performed on date of service |
"No authorization on file" | Prior authorization | Auth number present, valid date window covers DOS |
CO-4, CO-16, low allowed amount | Verification or coding | Place of service code, modifier 25, code specificity |
Claims aging past 30 days | Charge capture | Note closure time, charge entry backlog |
Duplicate claim denials | Submission | Claim watcher rules, overlapping date of service |
Timely filing denials | Submission | Payer-specific deadline alerts loaded in the system |
High write-off rate | Payment posting | Denial work queue ownership, appeal deadlines tracked |
Growing self-pay A/R | Payment posting | Point-of-service collection script, statement cadence |
Two rules for this exercise. Run A/R aging by payer, not just in total. MGMA recommends it because a stable blended number can hide one payer paying in 12 days and another in 60. And work denials by dollar value with the nearest deadline first, because a $40 correction and a $4,000 appeal are not the same unit of effort.
What should you measure every month?
If you track only one number, track first-submission denial rate. It sits upstream of everything else.
Metric | Healthy | High performance | Benchmark basis |
|---|---|---|---|
First-submission denial rate | 7-8% | Under 5% | MGMA DataDive benchmarking |
Clean claim rate | 90-95% | 98-99% | HFMA MAP Keys framework |
Days in A/R | 30-40 | Under 35 | MGMA polling, 2026 |
Cost to collect | 3-5% of net revenue | 2% | HFMA best practice, varies by size |
Copay collected at time of service | 72% | 85%+ | MGMA 2024 actuals |
Other patient balances collected at time of service | 27% | 45%+ | MGMA 2024 actuals |
Charge lag | 3-7 days | 2 days | MGMA sector data |
Our behavioral health billing KPIs monthly scorecard shows the format for building one of these around a single service line, which makes it easier to get adopted than a practice-wide version.
One staffing note. AAPC and the AMA both put the shortage of certified medical coders at roughly 30%. Practices waiting to hire their way out of a process problem will be waiting a while. RCM staffing shortages and what AI can cover covers which workflow steps to automate first and which to leave with a person.
Where the practice sits now
The CAQH 2025 Index reports that U.S. healthcare avoided an estimated $258 billion in administrative costs in 2024, a 17% increase on automated transactions, with medical administrative spend down 9%. It also puts the remaining opportunity at over $21 billion, and reports that more than 50% of health plans and 25% of provider organizations now use AI tools in administrative workflows.
That gap between what's automated and what isn't is where the remaining money sits. For practices serving a specific state, payer rules, filing deadlines, and enrollment requirements differ enough that a national checklist misfires. Our medical billing in Texas and medical billing in Florida pages lay out the state-specific pieces, and all state pages cover the rest.
If your first-submission denial rate is sitting above 7% and you can't name which stage is causing it, that's the conversation worth having. Run a revenue integrity assessment and we'll show you the number by stage, not a blended average that hides the leak.