
Behavioral-Health Billing KPIs: A Monthly Scorecard for Claims, Access, and Collections
Behavioral health billing KPIs worth tracking monthly, with benchmarks for clean claim rate, denial rate, AR days, and authorization turnaround.
A behavioral health billing KPI scorecard should track 9 numbers every month: clean claim rate, first-pass resolution rate, denial rate by reason, days in accounts receivable, net collection rate, authorization turnaround, no-show rate, patient balance aging, and provider enrollment status. That list covers claims, access, and collections in a single page.
Behavioral health runs a harder billing environment than most outpatient specialties. Denial rates in the specialty sit well above the general medical average, and no-show rates run roughly double primary care. You need a scorecard that measures the specific pressure points, not a generic template borrowed from a cardiology practice.
Here are the benchmarks, the formulas, and the questions to ask each month.
Key takeaways
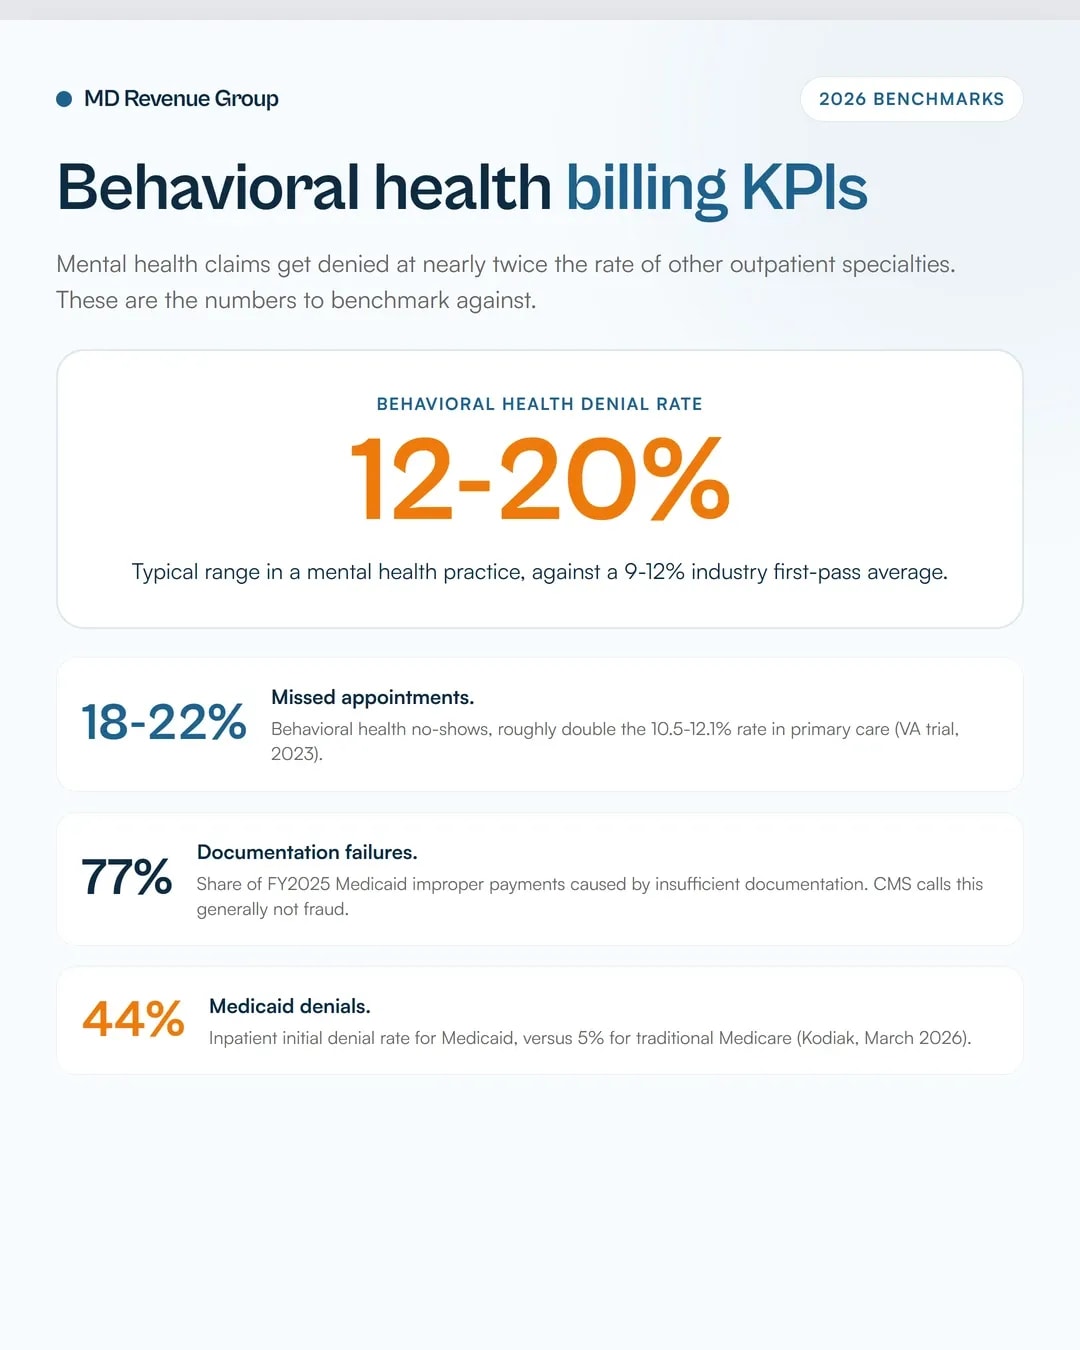
- Behavioral health denial rates run 12% to 20% in a typical practice, against a general industry first-pass denial range of 9% to 12% (MGMA/HFMA published benchmarks).
- CMS put the Medicare fee-for-service improper payment rate at 6.55%, or $28.83 billion, for fiscal year 2025. Documentation was the dominant root cause.
- Insurance appeal data is now public. KFF found 67% of Medicare Advantage prior authorization denials were overturned on appeal, 47% in Medicaid managed care, 43% in the ACA Marketplace.
- 90% of denials are preventable, according to research cited by Becker's Hospital Review.
- Behavioral health missed-appointment rates run 18.0% to 21.9%, roughly double the 10.5% to 12.1% seen in primary care (VA pragmatic trial, published 2023).
Which behavioral health billing KPIs should you track monthly?
Track 9 metrics. Anything more and nobody opens the report.
KPI | What it tells you |
|---|---|
Clean claim rate | Accuracy before the claim leaves your building |
First-pass resolution rate | Whether the payer actually paid you the first time |
Denial rate by reason (CARC) | Which specific workflow is failing |
Days in AR | How fast care converts to cash |
Net collection rate | What share of what you were owed you collected |
Authorization turnaround | Access bottleneck or not |
No-show rate | Lost capacity you can measure |
Patient balance aging | Where your patients are slipping through |
Provider enrollment status | Revenue you cannot bill at all until fixed |
Behavioral health practices that don't track denial rate by CARC code end up with one blended number that tells them nothing about where to fix anything.
What benchmarks should a behavioral health practice measure against?
These are the published benchmarks most medical groups report against.
Metric | Target | Notes |
|---|---|---|
Clean claim rate | 95% or higher | Below 90% signals a front-end problem |
First-pass resolution rate | 90% or higher | Measured as payment, not submission |
Denial rate | Under 5% | HFMA top quartile; industry average sits higher |
Days in AR | 30 to 40 days | High performers operate under 30 |
A/R over 90 days | Under 10% of total A/R | MGMA average runs about 13.5% |
Net collection rate | 95% or higher | AAFP healthy range is 95% to 99% |
Cost to collect | 2% to 4% of collections | Above 5% warrants investigation |
Compare your behavioral health denial rate to behavioral health benchmarks, not to a multispecialty average. An 8% denial rate that looks average for a surgical group is high for outpatient therapy.
Federal improper payment data sets the floor on what documentation failures cost. CMS reported a Medicare fee-for-service improper payment rate of 6.55%, or $28.83 billion, for fiscal year 2025, down from 7.66% the prior year. Of the FY 2025 Medicaid improper payments, 77.17% were caused by insufficient documentation, which CMS notes is generally not indicative of fraud or abuse.
That distinction matters for how you present findings internally. Most of what shows up in a denial queue is an administrative gap, and CMS says so plainly.
How do you calculate days in AR and net collection rate?
Days in AR is total accounts receivable divided by average daily charges. Take your average daily charges over a rolling 90-day period, not a single month, so a light billing week doesn't distort it.
Net collection rate is payments received divided by gross charges minus contractual adjustments.
Multiply that result by 100. Gross charges on their own tell you nothing useful here, because billed amounts sit far above contracted allowables in almost every payer contract.
The two numbers travel together. When AR days climb while net collection rate stays flat, the problem is submission volume or payer processing lag. When net collection rate falls while AR days look normal, money is aging out in your buckets and nobody is working it.
How do denial rate and clean claim rate differ, and why track both?
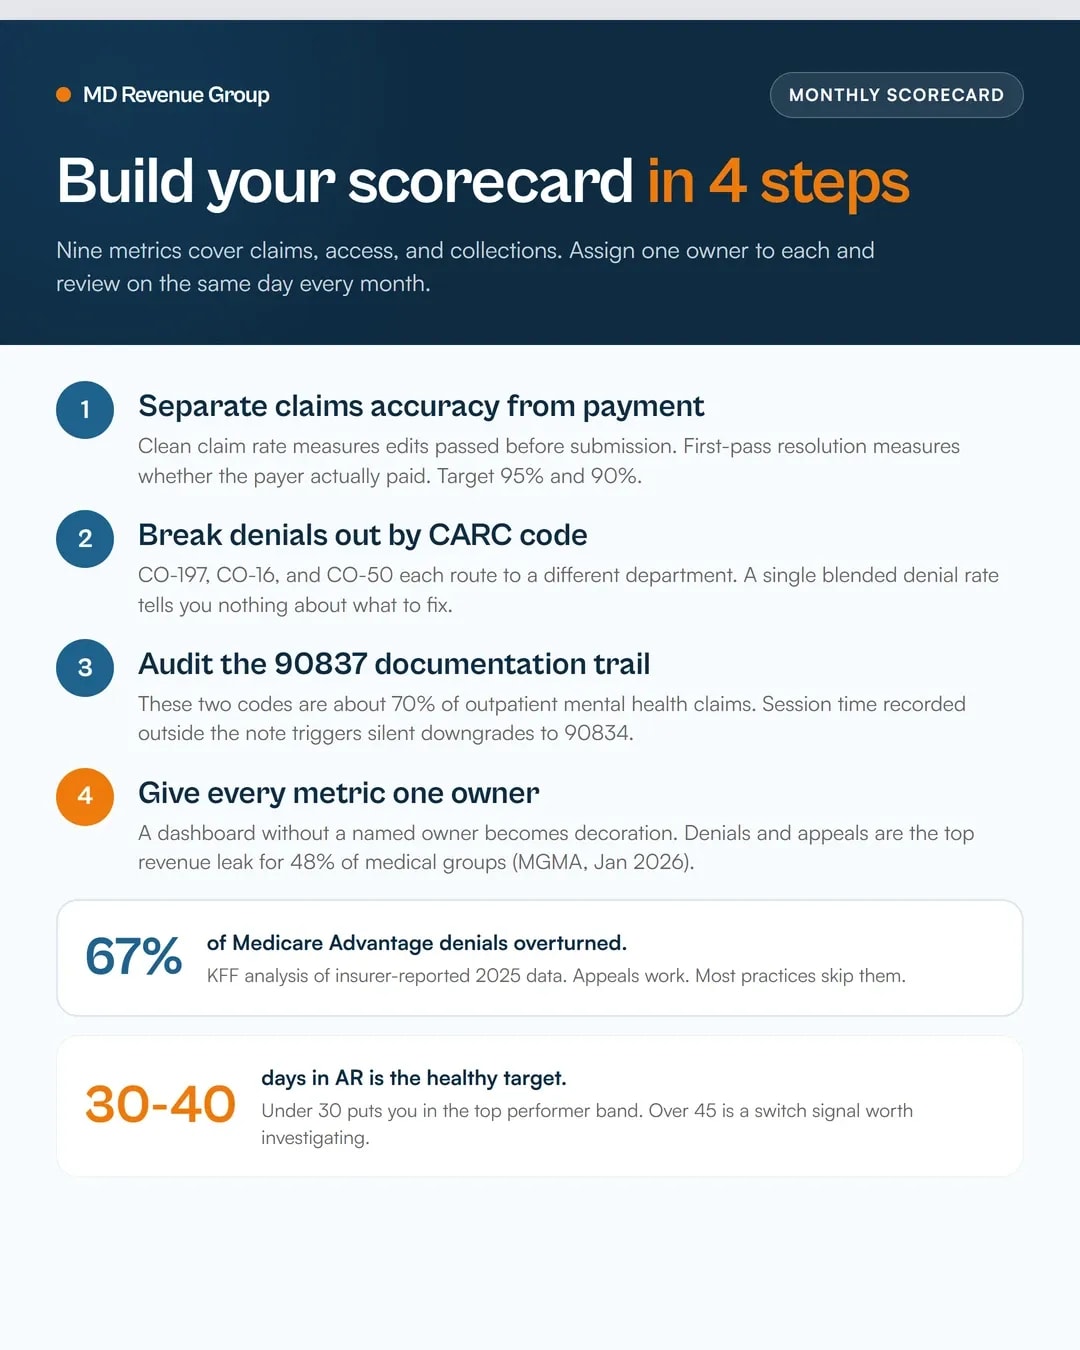
A clean claim passes edits before submission. First-pass resolution measures whether the payer actually paid it without rework. A claim can be clean and still get denied.
That distinction matters because the two failure points need different owners. Clean claim rate belongs to your front-end and coding staff. First-pass resolution belongs to whoever handles eligibility, authorization, and payer-specific rules.
Behavioral health denial rates land in the 12% to 20% range in a typical practice. Payer mix moves that number a lot. Kodiak Solutions' March 2026 benchmarking data, covering more than 2,300 hospitals, put inpatient initial denial rates at 44% for Medicaid, 21% for commercial, 18% for managed Medicaid, 11% for Medicare Advantage, and 5% for traditional Medicare.
Track the CARC code alongside the rate. CO-197 (precertification absent), CO-16 (missing information), and CO-50 (medical necessity) each send you to a different department. Our behavioral health claim denial management process maps each code to the workflow that prevents it.
What should authorization turnaround look like in behavioral health?
Median payer response time is about 1 day for standard requests, according to KFF's analysis of 2025 insurer-reported data. That's faster than most practices assume.
The real bottleneck is usually internal. Track authorization turnaround from the date you identify the requirement, not the date you submit to the payer.
KFF also found denial rates vary widely by market: 12% of standard requests denied in Medicare Advantage, 14% in Medicaid managed care, and 18% in the ACA Marketplace. Within Medicare Advantage, denial rates ranged from 5% to 17% across the six largest insurers.
That spread is why a single authorization metric can't tell you much. Break it down by payer.
Our behavioral health prior authorization workflow builds the queue so each payer gets its own tracker.
How should you measure patient balances and no-shows?
Behavioral health no-show rates run 18.0% to 21.9%, roughly double the 10.5% to 12.1% rate in primary care clinics. That gap comes from the same VA pragmatic trial published in 2023.
Track no-shows by provider and by visit type. A program with high no-shows in IOP looks completely different from one with high no-shows in weekly medication management.
For patient balances, watch the aging rather than a single balance total. Bad debt benchmarks generally sit under 5% of net patient revenue. Pre-service collections have improved industry-wide, with pre-service payments rising from 16% of self-pay collections in 2025 to 21% in 2026, according to a PayZen and HFMA survey of 205 revenue cycle leaders.
Which CPT codes drive your denial rate?
Two codes carry most of your volume. CPT 90834 (45-minute psychotherapy, 38 to 52 minutes) and CPT 90837 (60-minute psychotherapy, 53 minutes or more) together account for roughly 70% of outpatient mental health claims, according to CMS claims data.
Track your denial rate on those two separately from your overall rate.
90837 draws more payer scrutiny than 90834 for a simple reason: it pays more, which makes it a target. A session documented at 50 minutes bills as 90834. Billing 90837 for that session is upcoding under CMS guidelines, and payers flag practices that bill 90837 consistently without matching documentation of session length.
The failure mode worth watching is the silent downgrade. Session duration recorded in a separate time-tracking field the payer can't read produces claims that pass your scrubber and get downgraded anyway. One billing audit of a behavioral health group in Ohio found 23% of 90837 claims being auto-downgraded to 90834 because session duration lived outside the clinical note.
That is a documentation configuration problem, and it recurs monthly until somebody fixes where the time gets recorded. Our guide to psychiatry E/M and psychotherapy documentation controls covers the fix.
Where does provider enrollment belong on the scorecard?
Enrollment failures produce denials that no appeal will fix. Track credentialing status as a standing line item.
Medallion's 2026 State of Payer Enrollment and Medical Credentialing survey found 1 in 5 hospitals loses more than $1 million annually to credentialing and enrollment delays. CMS has also directed every state Medicaid agency to revalidate all enrolled providers within a 24-month window under 42 CFR 455.414.
State rules set the actual deadlines. New Jersey practices track revalidation against a state-run cycle, and our New Jersey medical billing guide covers the enrollment specifics for providers operating there.
Our behavioral health credentialing process tracks revalidation dates so a lapsed enrollment surfaces before claims start bouncing.
How do you turn the scorecard into action?
Assign one owner per metric. A dashboard without an owner becomes decoration.
The single highest-value review is denial reason, and it should happen monthly with the person who can actually fix the underlying process. Denials are now the largest revenue leak for most medical groups. A January 2026 MGMA Stat poll found 48% of medical group leaders named denials and appeals the single largest source of revenue cycle leakage, ahead of front-end issues at 23%.
Pair the scorecard with a quarterly look at whether your payer mix is shifting. A practice that added Medicaid volume will see denial rates climb without anyone doing anything wrong.
If you want a second set of eyes on your numbers, we run a free revenue cycle audit that benchmarks your clean claim rate, denial reasons, and AR aging against specialty-specific baselines.