
Revenue-Cycle Automation ROI: Measuring Manual Work, Denial Avoidance, and Cash Acceleration
A medical billing and collection ROI playbook: real CAQH, MGMA, and Experian data plus a 12-month model you can run before buying automation tools.
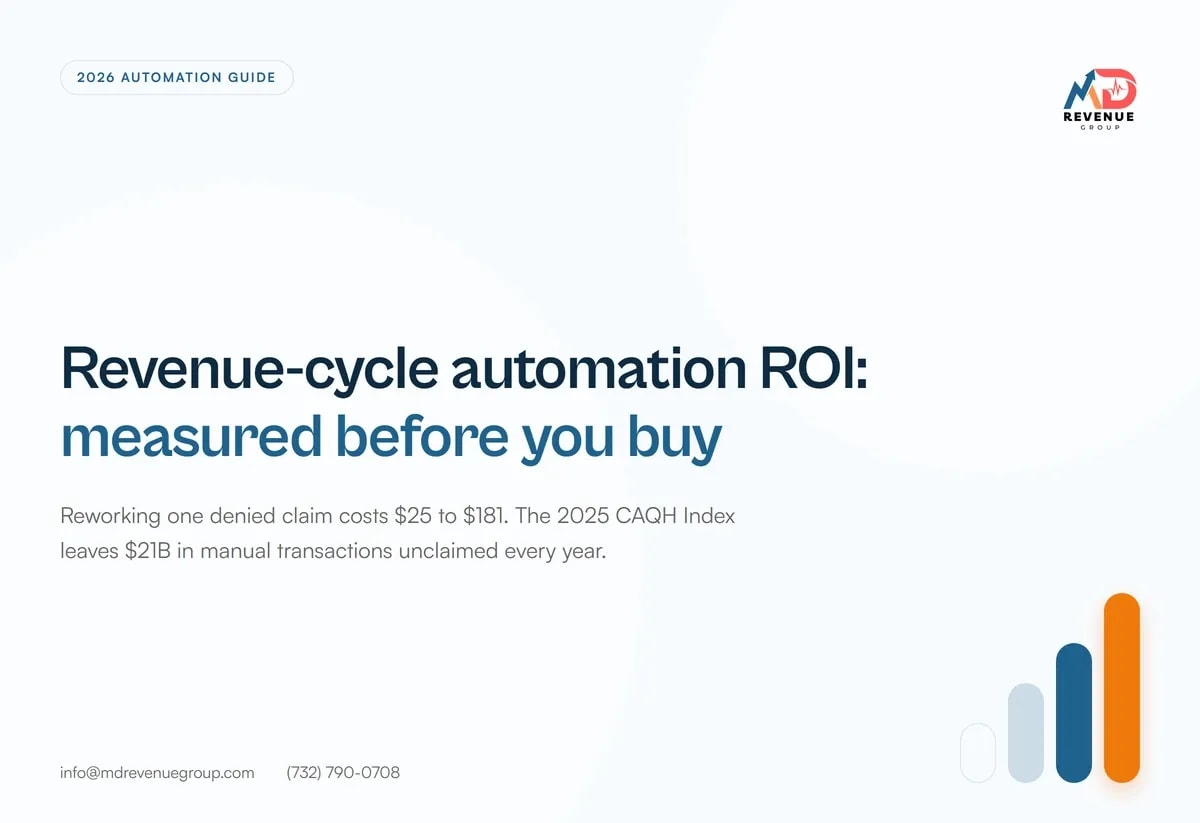
Revenue-Cycle Automation ROI: Measuring Manual Work, Denial Avoidance, and Cash Acceleration
Medical billing and collection automation pays back when you can count three things before you buy: the minutes your team spends on manual transactions, the denials you can realistically prevent, and the days you can pull out of A/R. Most practices skip the counting and buy the tool. That is how you end up with a $2,000 monthly platform nobody can justify at budget time.
The numbers to anchor your model are public. The 2025 CAQH Index pegs a $21 billion annual savings opportunity from automating transactions that still run manual, and estimates $258 billion in administrative costs were avoided in 2024 through electronic transactions. Experian Health's 2025 State of Claims report puts the average initial denial rate at 11.8% and the rework cost of a single denied claim at $25 to $181. CMS's FY 2025 improper payment rate of 6.55% ($28.83 billion) tells you where the friction lives: around 53% of improper payments trace to insufficient documentation, not fraud.
Below is the measurement framework, a worked 12-month model, and the verification steps we run before recommending any automation investment.
Key Takeaways
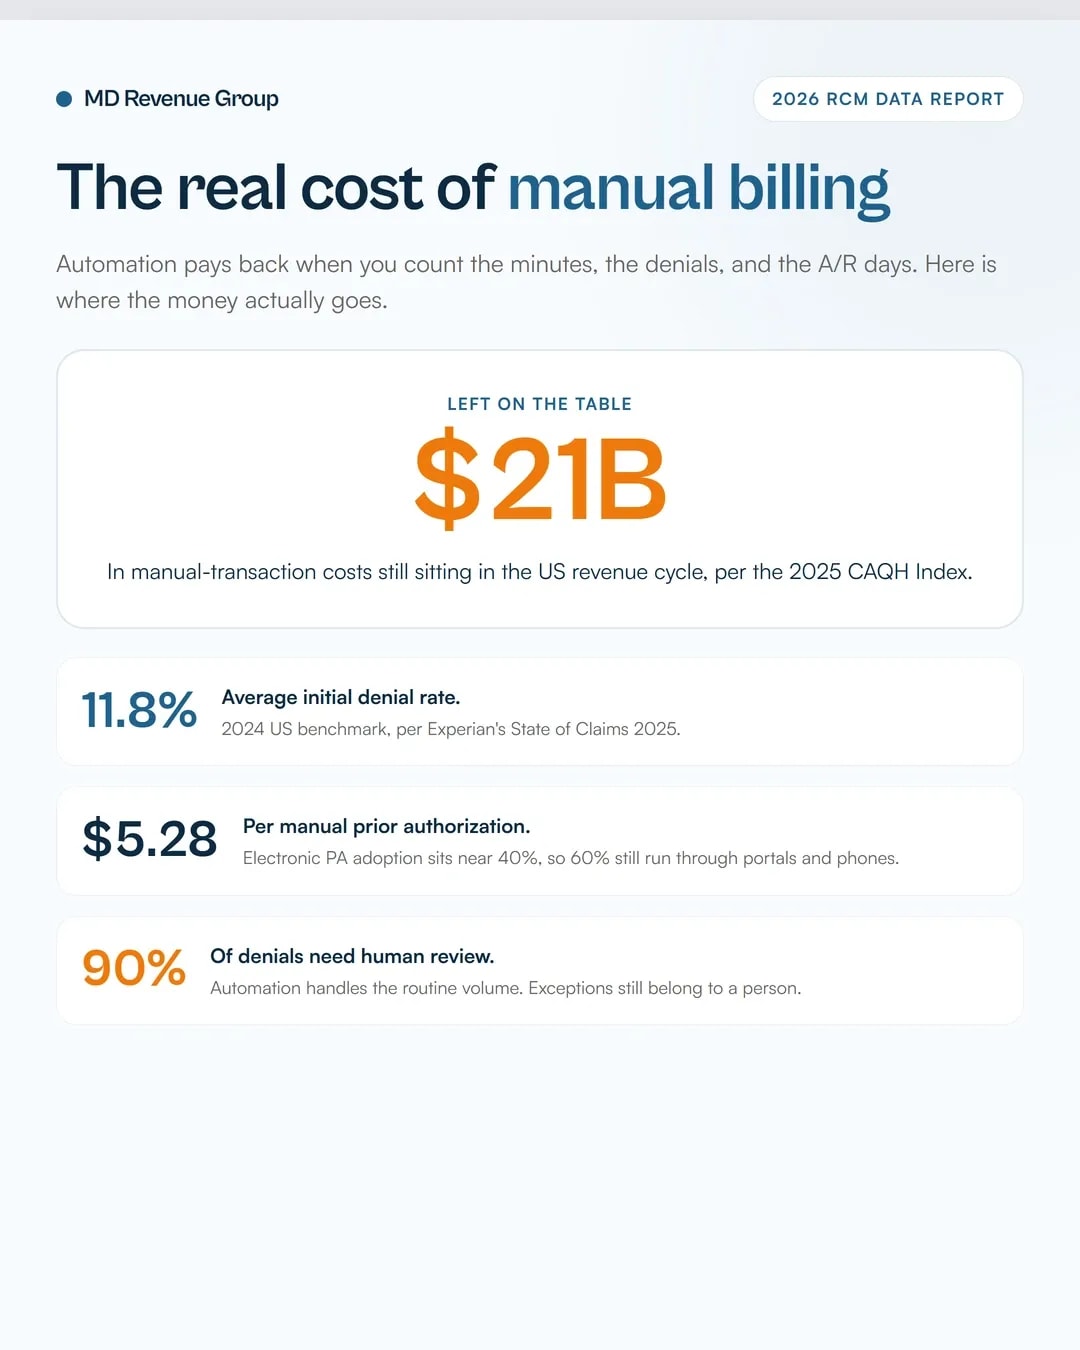
- The 2025 CAQH Index puts remaining manual-transaction savings at about $21 billion per year, with manual prior authorization running roughly $5.28 per transaction and electronic PA adoption stuck near 40%.
- AMA survey data pegs prior authorization at about 13 staff hours per physician per week. If you cannot attach a hours-to-dollars number to that, the ROI model is fiction.
- Experian's 2025 State of Claims data: 11.8% average initial denial rate, 90% of denials need human review, and 68% of denials trace to intake data errors automation could catch.
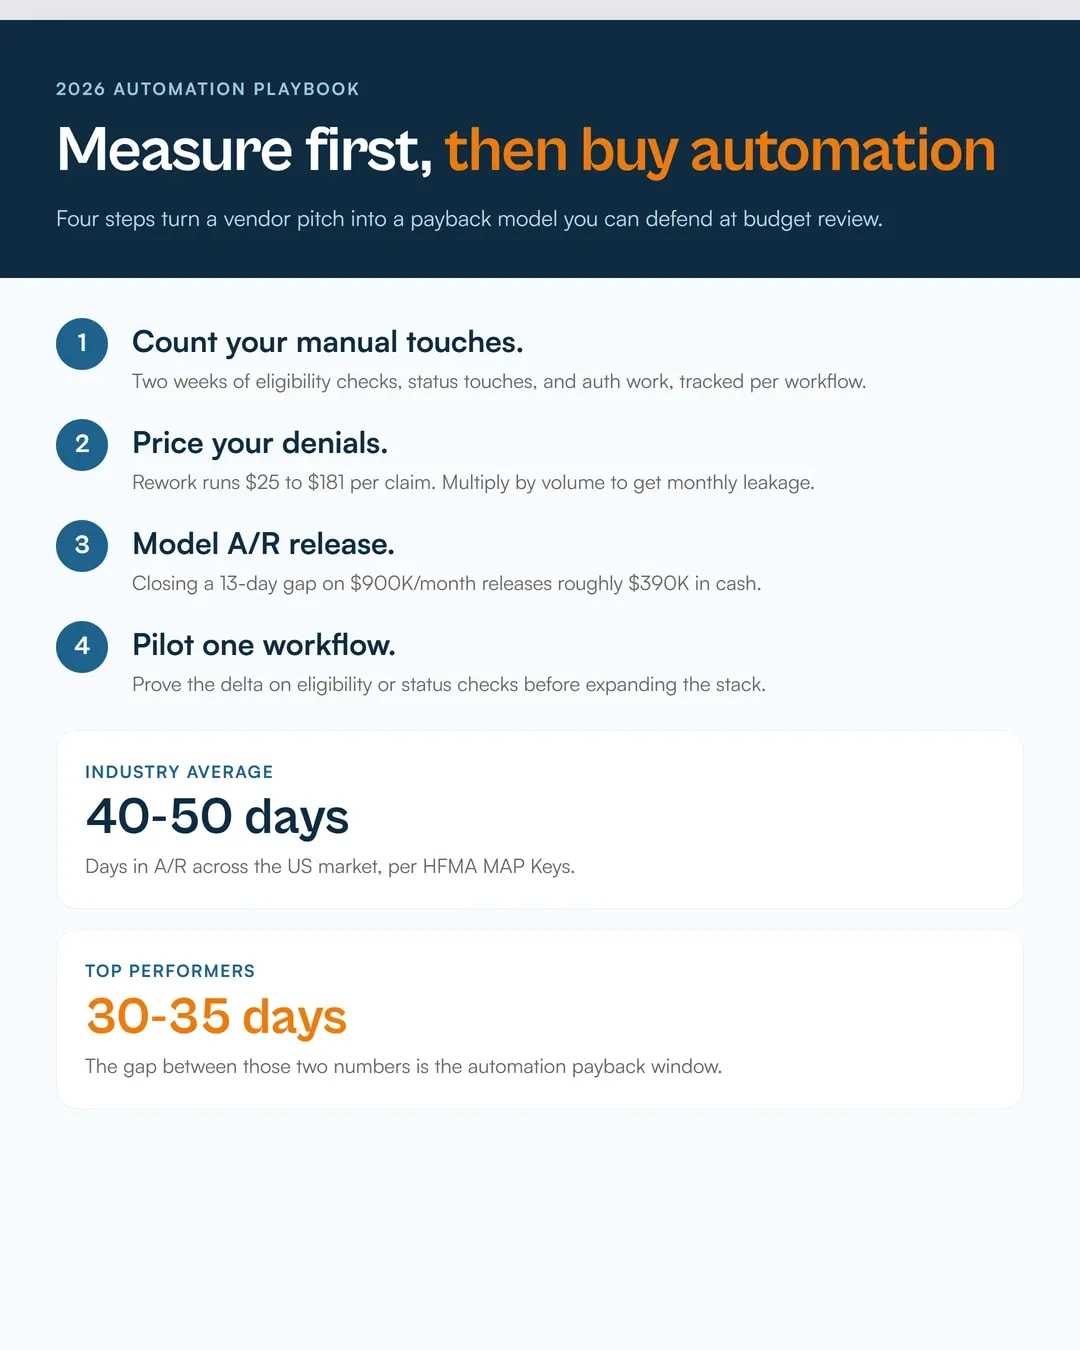
- HFMA MAP Keys benchmarks put average days in A/R at 40 to 50; top performers run 30 to 35.
- CMS FY 2025: 6.55% Medicare FFS improper payment rate, $28.83 billion, with roughly 53% tied to insufficient documentation.
What the 2025 CAQH Index actually shows
CAQH's 2025 Index is the cleanest baseline you will find. It tracks electronic adoption of the transactions your billing team touches daily: eligibility, claim status, claim submission, payment, and prior authorization.
The headline numbers: $258 billion in administrative costs avoided in 2024 through electronic transactions, a 17% year-over-year increase in cost avoidance, and a 9% reduction in medical administrative spend. The opportunity left on the table is about $21 billion.
Adoption is uneven, and that is your opening. Fully electronic adoption reached about 98% for claim submission, roughly 81% for claim status inquiries, and about 78% for claim payment. Electronic prior authorization is the outlier at around 40%, which means 60% of authorizations still run through portals and phone calls at a manual cost of roughly $5.28 per transaction.
Per-transaction economics from CAQH's earlier Index reports explain why this matters to a mid-size group. A manual claim status inquiry costs about $12 and takes about 24 minutes. No-touch electronic eligibility runs a fraction of that. MDRG's own breakdown of these numbers is in our CAQH automation opportunity guide, and the governance side is covered in AI and administrative workflows.
If your practice bills across state lines, adoption varies by state payer behavior. Practices billing in multiple jurisdictions often have to work within several payer portal ecosystems, which is exactly the drag we walk through for multi-state clients in our Texas medical billing services coverage.
Count the manual work first
ROI starts with a time study, not a demo. Track two weeks of touches per workflow: eligibility verification, claim status checks, prior authorizations, remittance posting, and payment posting exceptions.
The AMA's prior authorization physician survey gives you a published yardstick: practices complete about 39 to 41 PAs per physician per week, consuming roughly 13 hours of staff time, and 40% of physicians report hiring staff just for authorization volume. If your model assumes automation removes that 13 hours, you are overstating by half. Realistic expectation: first-pass automation handles the routine volume and exception queues keep the rest human. CAQH and industry analyses consistently show automation cutting manual labor per workflow by roughly 50%, with denial rates dropping once intake errors get caught.
Two more intake facts to build the baseline. Experian's 2025 survey found 68% of providers blame inaccurate or incomplete patient data at intake for denials, and 90% say denials still need human review before resubmission. Automation with human-in-the-loop review is the right architecture. Chasing full autonomy is how you get a $2,000 monthly tool with a 12-person clean-up queue.
If a workflow cannot be tied to a dollar number, it does not go in the ROI model. "Faster" is not a metric. "4.2 hours per week reclaimed, $520 a month at a $28 blended rate" is a metric.
Denial avoidance: where ROI shows up fastest
Denials are the easiest place to prove payback because the inputs are countable. The 2024 initial denial rate across the industry averaged 11.8%, per Experian, and 41% of providers report rates at or above 10%. Rework costs $25 to $181 per claim depending on payer and complexity. MGMA benchmarks cluster near $25 per rework touch, and roughly half to two-thirds of denied claims never get worked at all.
Pull your own numbers: denied claims per month, average rework hours, write-off rate on never-worked denials. Behavioral health teams should weight this differently. In 2023, about 30% of mental health claims were denied versus 19% across other claims, so the per-dollar-avoided math looks different and the case for intake automation is stronger. Our how to reduce claim denials playbook covers the upstream checks in detail.
A conservative model assumes your automation prevents 2 to 3 percentage points of denials in year one. Steeper claims usually trace to one workflow, most often eligibility or missing authorizations. Our denial management article walks through the root-cause split, and our medical billing audit service exists for exactly this baseline work.
Cash acceleration: days in A/R beat tool features
Denial prevention protects revenue. A/R reduction releases it. HFMA's MAP Keys benchmark puts the industry average at 40 to 50 days in A/R, with top performers running 30 to 35. Closing a 13-day gap on a practice collecting $900,000 a month frees roughly $390,000 of cash in the ramp, then compounds as the cycle stays shorter.
The drivers are boring: clean claims going out the first time, faster status checks, faster remittance posting, and fewer rework cycles. CMS's FY 2025 data is the backdrop. The Medicare FFS improper payment rate ran 6.55% ($28.83 billion), and documentation gaps drove the largest share. Clean, complete first submissions are the defense, and they are precisely what automation needs to capture at intake.
This is the part of the ROI model that vendors skip. Ask for the A/R aging curve from two comparable client implementations, not the reference logo. We publish the same framing for practices coming off billing transitions in our revenue cycle management guidance.
A worked 12-month ROI model
Assumptions: an 8-clinician practice, 6,400 claims a month, $145 average collected per claim, $28/hour blended staff cost.
Input | Manual baseline | With automation (year 1) | Delta |
|---|---|---|---|
Eligibility checks | 6,400/mo at 8 min, ~853 hrs, ~$23,900/mo | ~2,700 hrs cut to ~560 hrs, ~$15,700 saved | ~$15,700/mo |
Claim status touches | 3,200/mo at 24 min, ~1,280 hrs, ~$35,800/mo | ~70% touchless, ~$25,000/mo saved | ~$25,000/mo |
Prior auth labor | 13 hrs/wk/physician, ~$11,900/mo | 40% reduction, ~$4,800/mo saved | ~$4,800/mo |
Denials at 11.8% | 755/mo, many at $95 average rework | 3-point reduction to 8.8%, 192 fewer denials, ~$18,200 rework avoided plus ~$16,700 recovered collections | ~$34,900/mo |
Days in A/R | 46 days | 33 days | ~$390,000 cash released |
Year-one gross impact: roughly $80,400/month in avoided cost plus recovered revenue, plus the A/R release. At a $60,000/year tool stack, that is better than a 12-month payback in month 1. If your model does not show this shape, the tool is solving a problem you have not measured. Pull the real numbers, then iterate. Our revenue integrity tool is built for exactly this kind of pre-purchase model.
How to verify vendor claims before you sign
Ask for three things:
- A named payer list. Electronic adoption only helps where the payer supports the standard transaction. CAQH's adoption deltas (98% submission, 81% status, 78% payment, 40% PA) are national averages, so your payer mix moves the result.
- Baseline metrics from a comparable practice. Same specialty, same claim volume, same EHR. A 60% reduction claim with no client reference is marketing.
- Implementation timeline with a 90-day ramp assumption. Month-one ROI almost never exists. Payment posting and rework queues clean up retroactively, which is why the model above spreads gains across the year.
If a vendor cannot produce these, compare them against the numbers in this article and walk. We run practices through this scorecard when they are evaluating outsourcing versus in-house automation spend. If that sounds like your situation, start at our free audit page.
Common questions
How long before automation ROI shows up in the P&L? Most practices see denial and A/R movement inside 60 to 90 days. Labor-hour savings take longer because exception queues shift people rather than remove them. Budget for a full quarter before you judge the tool.
What metric should I report to ownership? Track denials avoided per 1,000 claims, rework hours per month, days in A/R, and cash collected on first submission. Those four numbers answer whether the tool earns its cost.
Can small practices justify automation? Yes, if you scope it to the highest-volume workflow: usually eligibility and claim status. Do not buy the full suite on day one. Start with the workflow that carries the most manual touches, prove the delta, then expand.
What about behavioral health practices? The same model applies, but weight denial prevention higher. Behavioral health denial rates have historically run close to double the medical/surgical average, and documentation is the main audit trigger.
The short version: count your minutes, attach a dollar figure to intake errors and rework, and demand a before-and-after A/R curve from any vendor. Practices running a 13-day A/R gap have $390,000 in cash tied up right now. Every month you wait is that money sitting in someone else's account. If you want a second set of eyes on your baseline, request a free revenue audit.
Reviewed by: MDRG Revenue Integrity Review team. Sources cited: CAQH 2025 Index, Experian State of Claims 2025, AMA Prior Authorization Physician Survey, MGMA, HFMA MAP Keys, CMS FY 2025 improper payment reporting.