
AI Medical Coding Audit Risk: Your Scribe Codes Higher, the Payer's AI Flags It
AI medical coding audit risk is now a payer algorithm problem. What the Peterson report and the $942M Blue Cross fight mean for your codes, plus the fix.
AI medical coding audit risk is the distance between what your AI scribe writes into the note and what a payer's algorithm decides to pay. Two reports published within days of each other in October 2026 turned that distance into a live problem for independent practices.
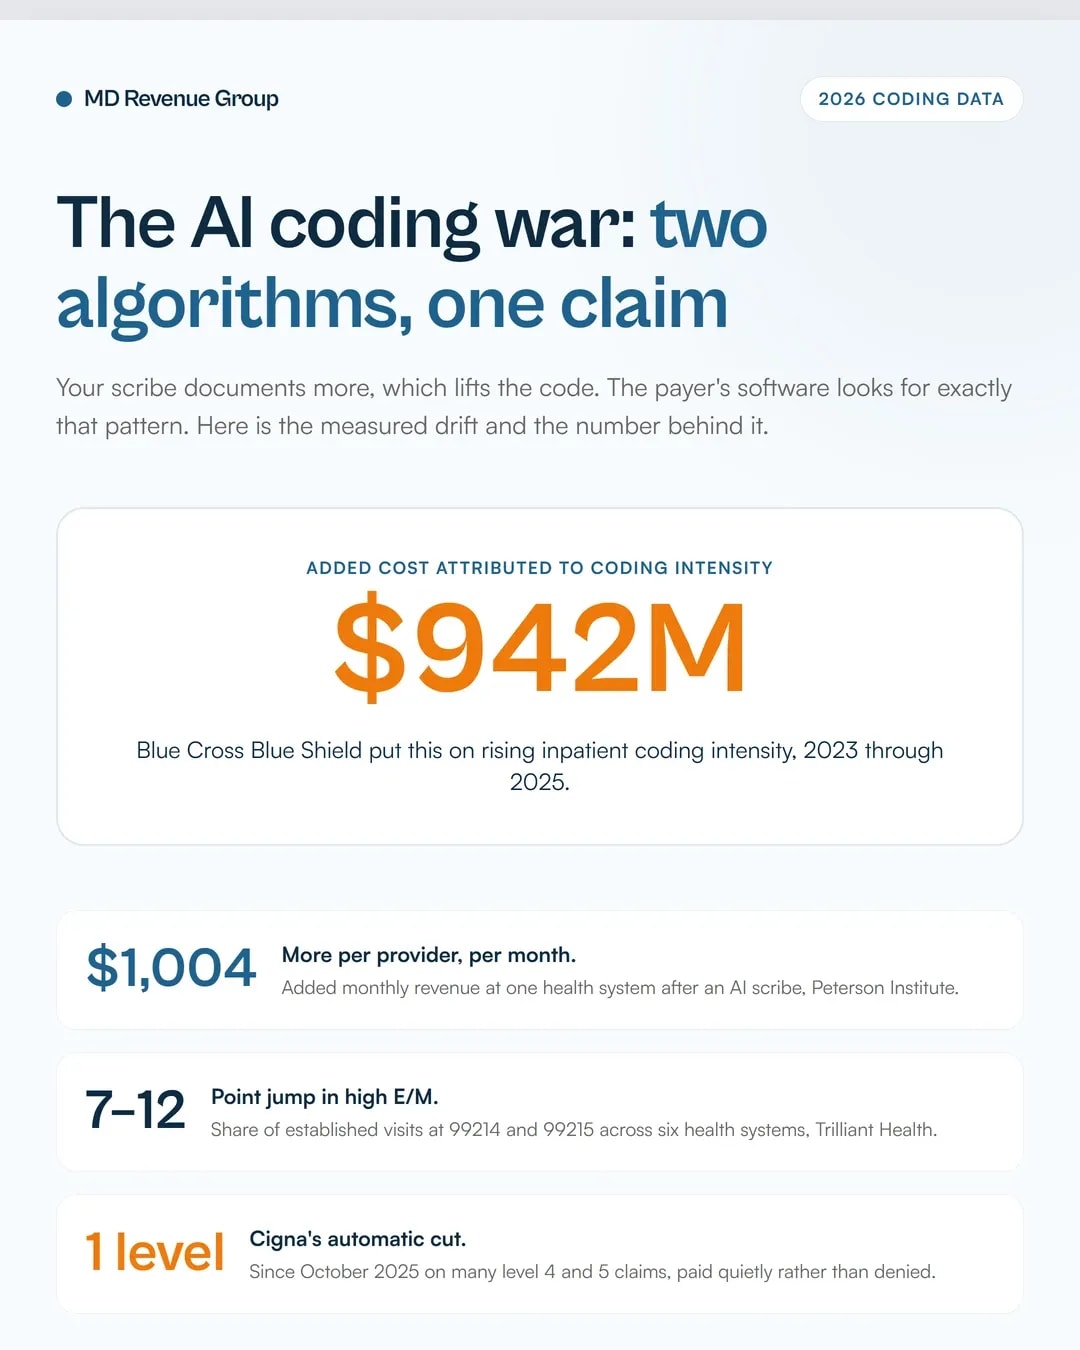
The Peterson Health Technology Institute reported on October 14 that AI documentation and billing tools are driving healthcare costs up without improving patient outcomes. Blue Cross Blue Shield Association published a white paper on September 24 saying rising inpatient coding intensity added about $942 million in two years. The American Hospital Association rebutted it on October 5.
Both of those things are true at once. Your scribe is pushing your E/M levels up, and payers are now running their own algorithms to find the practices that moved.
Key takeaways
- One multihospital system saw Level 5 established-patient encounters rise 5% and Level 4 rise 7% after deploying an AI scribe, worth an average of $1,004 in added monthly revenue per provider (Peterson Health Technology Institute, citing a KLAS Research analysis).
- Blue Cross Blue Shield Association traced about $942 million in added cost to rising inpatient coding intensity between 2023 and 2025, with 55,000 more complex cases than the 2023 baseline and $11,000 of added cost per excess case.
- The American Hospital Association's math puts the effect on total commercial spending at about 0.3 percentage points, against 5% to 7% annual premium growth.
- Trilliant Health found six large health systems shifted 7 to 12 percentage points of established-patient visits into the two highest E/M codes after deploying ambient scribes.
- Cigna began automatically dropping many level 4 and 5 E/M claims by one level in October 2025 unless documentation clearly supports the higher complexity.
- Practices that answer an audit with a defensible record win. Practices that answer with a longer note lose.
What the Peterson report found
The Peterson Health Technology Institute published its analysis on October 14, 2026. Its finding is blunt: administrative AI used for documentation, coding, billing and prior authorization entrenches inefficient workflows and fuels inflationary billing instead of cutting waste, under fee-for-service incentives.
The institute, founded in 2023 and funded by the Peterson Center on Healthcare, built the report on 2025 and 2026 workshops with health system, health plan, technology company and federal agency leaders (Becker's Hospital Review).
The central example is one multihospital health system that deployed an AI scribe across ambulatory and emergency department settings. Level 5 established-patient encounters rose 5%. Level 4 rose 7%. That added an average of $1,004 in monthly revenue per provider, the report says, citing a KLAS Research analysis of one AI scribe vendor's customers.
Two more findings matter to an independent practice. Health plans report an immediate jump in coding intensity when providers switch on AI tools, and several are deploying their own algorithms to flag coding outliers. On prior authorization, insurers and vendors have not produced evidence that AI lowers the average cost per claim once the cost of the tool is factored in, and faster submissions are creating more back-and-forth.
Caroline Pearson, the institute's executive director, put it this way: "On our current trajectory, AI is set to exacerbate existing system failures." She called for payment models that reward outcomes over activity and pointed to CMS's ACCESS model, a 10-year outcome-based program that launched in July 2026 with more than 160 participating organizations.
The same report notes the irony. The clinical AI with the most room to expand access, hypertension management and mental health chatbots among them, stays stalled behind payment, liability and licensure rules written for human clinicians.
The $942 million fight: Blue Cross versus the AHA
The Peterson report landed on top of a fight that had already been going for three weeks. Both sides have numbers, and both sides have holes.
Issue | What BCBSA says | What the AHA says |
|---|---|---|
Core claim | Rising inpatient coding intensity added about $942 million to Blue plan spending over two years | Coding intensity reflects older, more complex patients, not improper billing |
Period analyzed | Blue System inpatient claims, 2023 through 2025 | The analysis never reviews a medical record |
Complex-case share | Rose from about 37% to 40% | Direction is expected when acuity rises and low-acuity care moves outpatient |
What drove it | Secondary diagnoses such as anemia and low sodium, often visible from a single lab result | The analysis does not identify which claims involved AI tools |
AI connection | The rise "coincides with hospitals adopting new AI-assisted billing software" | The report did not measure AI use at individual hospitals |
Bowel procedure detail | Hospitals with the fastest coding growth classified 75.6% of cases as complex against 65% elsewhere, with lower ICU use and lower transfusion rates | Higher coded complexity with lower resource use is an inference, not a record review |
Materiality | Roughly $942 million over two years | Inpatient coding intensity added about 0.3 points to total commercial spending growth, against 5% to 7% annual premium growth |
Who's been upcoding | Providers using AI documentation tools | BCBSA itself has named prescription drugs a major driver of premiums |
Sources: Becker’s Hospital Review on the AHA response and Fierce Healthcare on the BCBSA analysis.
Read those two columns together and one fact stays solid for every practice. BCBSA's own analysis is built on claims, not charts. The association acknowledged the limit: a claims-only study cannot tell whether patients were actually sicker or whether the coding escalated without a matching change in care.
The AHA's materiality math is the part most managers skip. A March 2026 BCBSA brief found per-member commercial inpatient costs rose about 9% from 2023 to 2024, and attributed roughly 20% of that increase, about 1.8 percentage points, to coding intensity. Inpatient facility care is about 17% of employer-sponsored spending, according to the Health Care Cost Institute. Multiply those and inpatient coding intensity moved total commercial spending growth by about 0.3 points. Employer premiums rose 5% to 7% a year over the same window.
The AHA's closing evidence points back at the payers. An HHS Office of Inspector General audit of the Blue Cross and Blue Shield of Alabama Medicare Advantage contract found unsupported diagnoses in 247 of 271 sampled enrollee-years. The Justice Department alleged that Anthem, now Elevance Health, kept diagnoses in its Medicare Advantage submissions after its own chart reviews failed to support them. The association's line: "Accurate diagnosis capture is not a coding problem; it is a patient care imperative."
BCBSA's side has harder numbers than that. About 70% of the coding intensity increase came from more than 55,000 cases above the 2023 baseline where secondary diagnoses pushed a claim into a higher-severity diagnosis-related group. That accounts for $653 million of the total, or about $11,000 per excess complex case. Inside major bowel procedures, the highest-complexity claims rose from 10.2% to 22.7% while the least complex fell from 36.6% to 32.8%, together nearly $61 million of incremental claim cost. On posthemorrhagic anemia, the top quartile of hospitals coded it on 13.7% of cases against 9.9% for the rest, then transfused fewer of those patients, 16.9% against 19.3%.
Luke Chalker, BCBSA senior vice president of product and data science, said the analysis found no change in corresponding care for a more complex patient. Razia Hashmi, BCBSA vice president of clinical affairs, said the likelihood that this is technology-enabled upcoding is higher in her view.
Neither side has run a practice-level audit of your charts. That job is yours.
How far your E/M distribution actually moved
You do not need the Peterson report to know whether your coding moved. You need your own E/M distribution, by provider, before and after.
Trilliant Health ran national all-payer claims analysis on six large health systems that announced ambient AI scribing deployments, covering 13 states, from 2018 through 2024. Across all six, the share of established-patient visits billed at the two high-intensity E/M codes, 99214 and 99215, rose 7 to 12 percentage points. New-patient high-intensity codes, 99204 and 99205, rose 12 to 20 percentage points (Trilliant Health).
Health system | 99214 and 99215 share, 2018 | 2024 | Change |
|---|---|---|---|
System A | 59.8% | 67.2% | +7.4 points |
System B | 40.9% | 52.7% | +11.8 points |
System C | 65.3% | 72.9% | +7.6 points |
System D | 50.4% | 60.2% | +9.8 points |
System E | 56.6% | 64.6% | +8.0 points |
System F | 47.8% | 57.7% | +9.9 points |
The new-patient side moved harder. System C went from 60.5% to 80.0% of new-patient visits billed at 99204 or 99205. System A went from 51.3% to 64.8%.
Trilliant's separate 2025 analysis put the same drift in front of ambient scribes. Between 2018 and 2023, CPT 99284 in the emergency department rose from 32.5% to 39.6% of visits. Urgent care 99204 rose from 34.0% to 40.6%. Physician office 99214 rose from 38.5% to 45.0%.
Why does an 8 point move matter to a practice manager? Trilliant's own framing does the math. Even modest per-code rate differences of $10 to $40 translate into millions of dollars once you scale them across every outpatient site. Peterson's single health system saw $1,004 per provider per month. Multiply that by your provider count and your months, and the number lands in six figures fast.
The same research offers the argument for letting the scribe run. A study of 263 providers across six health systems found that after 30 days with an ambient AI scribe, provider burnout fell from 51.9% to 38.8%. Trilliant also notes that the 2021 E/M revisions deleted CPT 99201 and moved level selection onto medical decision making or total time, which makes an accurate timestamped record of the encounter a coding asset rather than a clerical one.
Vendor data puts numbers on the same shift. Riverside Health in Virginia reported an 11% rise in physician work relative value units and a 14% increase in documented Hierarchical Condition Category diagnoses per encounter after deploying Abridge. A 2024 Texas Oncology study found ambient scribes lifted documented diagnoses from 3.0 to 4.1 per encounter (npj Digital Medicine policy brief).
What the payer side is already doing
The Peterson report's line about health plans deploying algorithms to flag coding outliers is not theoretical. Starting October 1, 2025, Cigna began automatically reducing many level 4 and 5 E/M claims by one level unless documentation clearly supports the higher complexity (Cigna's reimbursement policy notice). Aetna Better Health has applied similar claim and code reviews.
Those edits do not arrive as denials. They arrive as a paid claim at a lower code, which is why they hide from a normal denial report.
That silent reduction is the real exposure in AI medical coding audit risk. Your denial rate looks fine while your revenue quietly drops a level. The payer downcoding explainer we published earlier covers how to find these in your 835 remittance data.
There is one more structural change. Ambient scribes create a timestamped digital record of every provider-patient encounter. Trilliant's researchers make the point plainly: unlike other longstanding fraud types, the evidence needed to verify whether a code was justified now exists, and the same record a payer would use to test you is the record you can use to prove yourself.
On prior authorization, Peterson found no evidence that AI lowers average cost per claim once the tool cost is counted. Faster submissions are producing more back-and-forth, not less.
What AI medical coding audit risk means for your practice
Take the argument away from the think tanks and put it on your own claim file. Four things follow.
Your signature is the liability. The physician who signs the note is the one who attested to it. The ambient documentation and coding risk controls we wrote for revenue cycle teams apply here: the tool drafts, a human signs, and that human owns the record.
E/M level comes from medical decision making or total time, not note length. A 20 paragraph note that never names the data reviewed or the risk of management supports a level 3. A short note that names both supports a level 4 every time an auditor reads it.
Audit trails now exist on both sides. Every ambient scribe session leaves a timestamped record of the encounter. A payer auditing your coding can compare that record to your note line by line. Practices that never faced chart-level scrutiny before can now face it at scale.
Do not fight a downcoding with a longer note. Appeal with the specific MDM element or the documented total time, cited to the AMA guidelines. Practices that win appeals do it with structure, not volume. If your payer has an audit exposure problem, our forensic RCM audit service maps where the money actually goes.
Your practice playbook
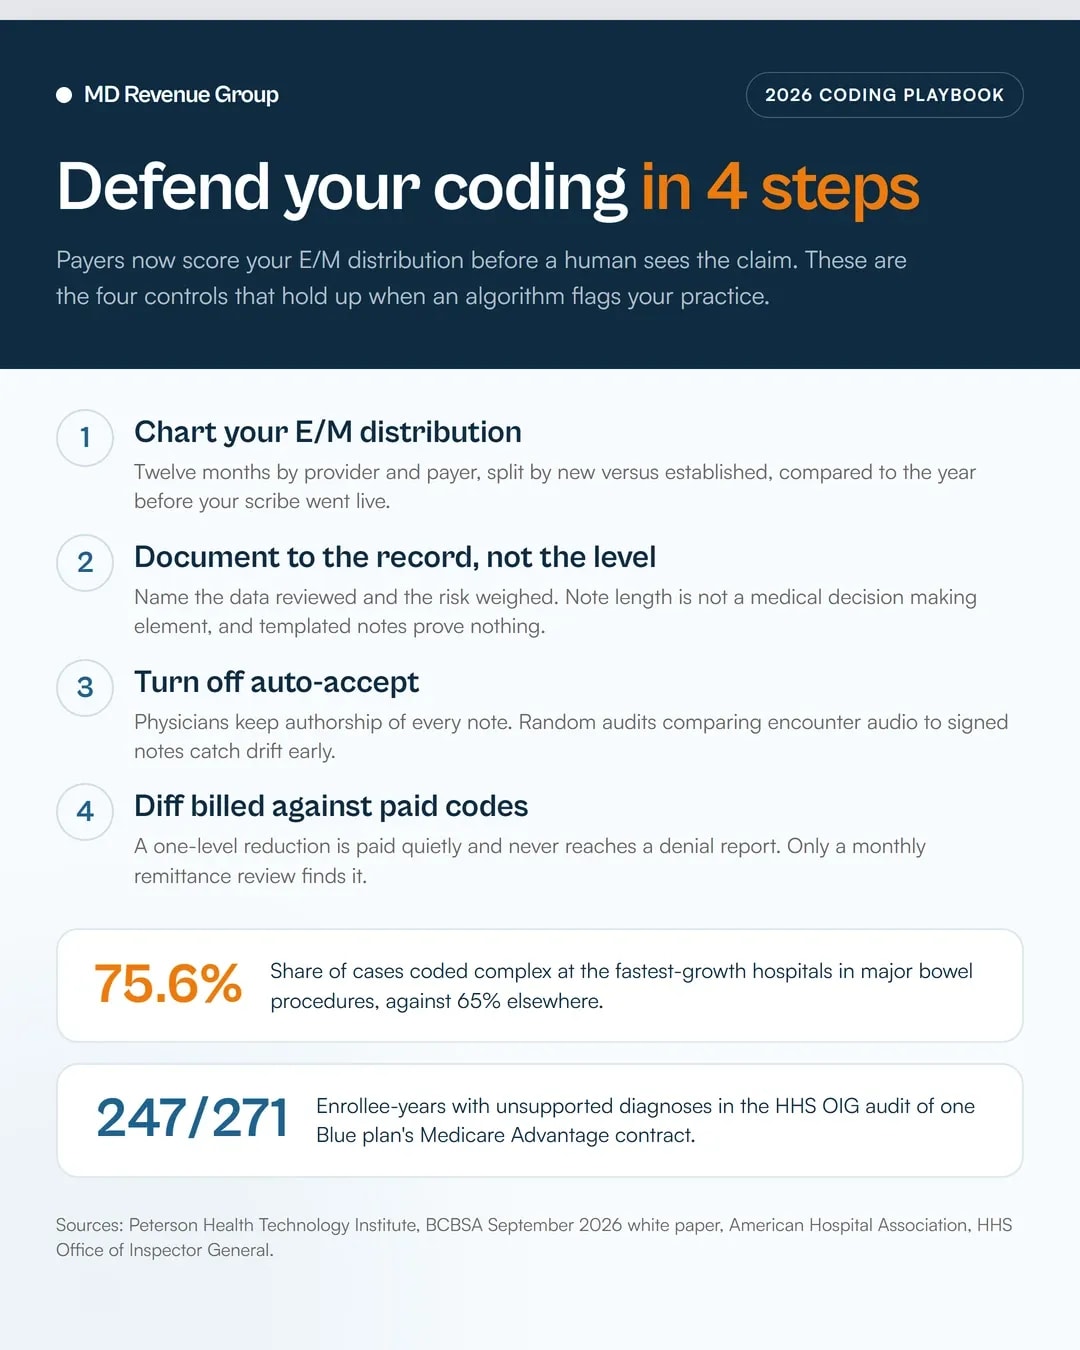
1. Measure your own E/M distribution before you argue about anyone else's
Pull 12 months of E/M codes by provider and by payer. Separate 99213, 99214 and 99215 for established patients, and 99203, 99204 and 99205 for new patients. Compare that to the twelve months before your scribe went live. The Trilliant table above is your peer benchmark: a 7 to 12 point jump in established-patient high-intensity share is what six large systems did.
2. Benchmark coding intensity against your specialty, not the national average
A rise of 8 points means something different in cardiology than in primary care. Our medical coding resource hub has the code-level detail, and a medical billing audit will score a sample of your charts against the AMA MDM table.
3. Document to the record, never to the level
Write what happened in the room. If you reviewed an outside test, say which test, whose reading, and what you concluded. If you made a prescription decision, name the drug class and the risk you weighed. That is what an auditor scores. Note length is not a medical decision making element, and a copy-forward template that reads the same across every patient in a week does not support a level.
4. Turn off auto-accept
If your ambient tool can auto-accept a note or auto-suggest a code, turn that off. The npj Digital Medicine policy brief names physician retention of authorship as the first guardrail, with random audits comparing audio to signed notes to catch drift toward chart-stuffing.
5. Tighten pre-bill review on the two highest levels
Put a human in front of every 99215 and 99205 before it leaves. Have that reviewer confirm the MDM elements or the total time, then sign. Sampling 10 of your highest-level claims every month costs a few hours and gives you a defensible answer the next time a payer sends a records request.
6. Compare billed codes to adjudicated codes every month
Pull your 835s, group by payer and provider, and diff the code you billed against the code you got paid. Cigna's one-level reduction never appears in a denial report. It appears here and nowhere else. Without this check, clean claim rate and denial management data will tell you your revenue cycle is healthy while the money leaks anyway.
7. Get ready for more records requests
Peterson reported that claims pending medical record review are part of what's stretching the cycle. Assume the request volume rises and keep your documentation retrieval process fast. If you want to know how many records requests you already absorbed last quarter, our revenue cycle management team pulls that number from your clearinghouse feed.
Get your coding profile measured
Nobody can tell you whether your coding moved from a news article. We pull your last 24 months of E/M claims, chart the distribution by provider and payer, and compare it against the peer movement Trilliant documented. You get the number whether or not a payer ever looks. Request a free audit and we'll run it.
Frequently asked questions
An AI scribe changes the note your coder works from. Fuller documentation often supports a higher E/M level, which is accurate coding when the encounter genuinely supported it. The risk appears when the added detail was not in the encounter: hallucinated findings, copied-forward detail, or a code bumped because the note got longer. Ambient platforms also leave a timestamped record of every encounter, so a payer can compare the audio to the signed note.
Yes, and they already do. Payers can request the medical record to confirm the documentation supports the level billed, regardless of how the note was drafted. Starting October 2025, Cigna began automatically reducing many level 4 and 5 E/M claims by one level unless documentation clearly supports the higher complexity. Aetna Better Health has applied similar reviews.
No. BCBSA's September white paper analyzed Blue System inpatient claims from 2023 through 2025 and found the complex-case share rose from about 37% to 40%. It said the rise coincides with hospitals adopting AI-assisted billing software. The report did not measure AI use at individual hospitals, and BCBSA acknowledged the analysis relies on claims rather than clinical documentation. The American Hospital Association disputes the causal claim.
No. Independent data shows a real clinical gain: a study of 263 providers across six health systems found burnout fell from 51.9% to 38.8% after 30 days with an ambient scribe. The gains erode when baseline rates adjust downward after the whole industry moves. Practices that measure their own E/M distribution, keep a clinician signing every note, and document medical decision making explicitly are the ones that hold what they gained.
Most practices do not know it. Run the measurement: 12 months of E/M codes by provider, split by established and new patient, compared to the 12 months before deployment. If the high-intensity share jumped by more than a few points, audit a sample against the AMA medical decision making table before a payer does it for you. Most discoveries are cheaper to fix from your own data.
Get your coding profile audited
Two reports, three weeks of arguments, and every number in them describes somebody else's claim file. Yours is the one that pays your staff. We pull your E/M distribution, compare it to the peer movement, and tell you exactly where your documentation supports the level you billed and where it does not. Request a free audit and we'll put it on your provider roster.