
The 2026 wRVU Efficiency Adjustment: What It Costs Your Practice, by Specialty
The 2026 wRVU efficiency adjustment cut work RVUs 2.5% on 7,700 codes. See the dollar loss by specialty, who absorbs it, and the four fixes to make now.

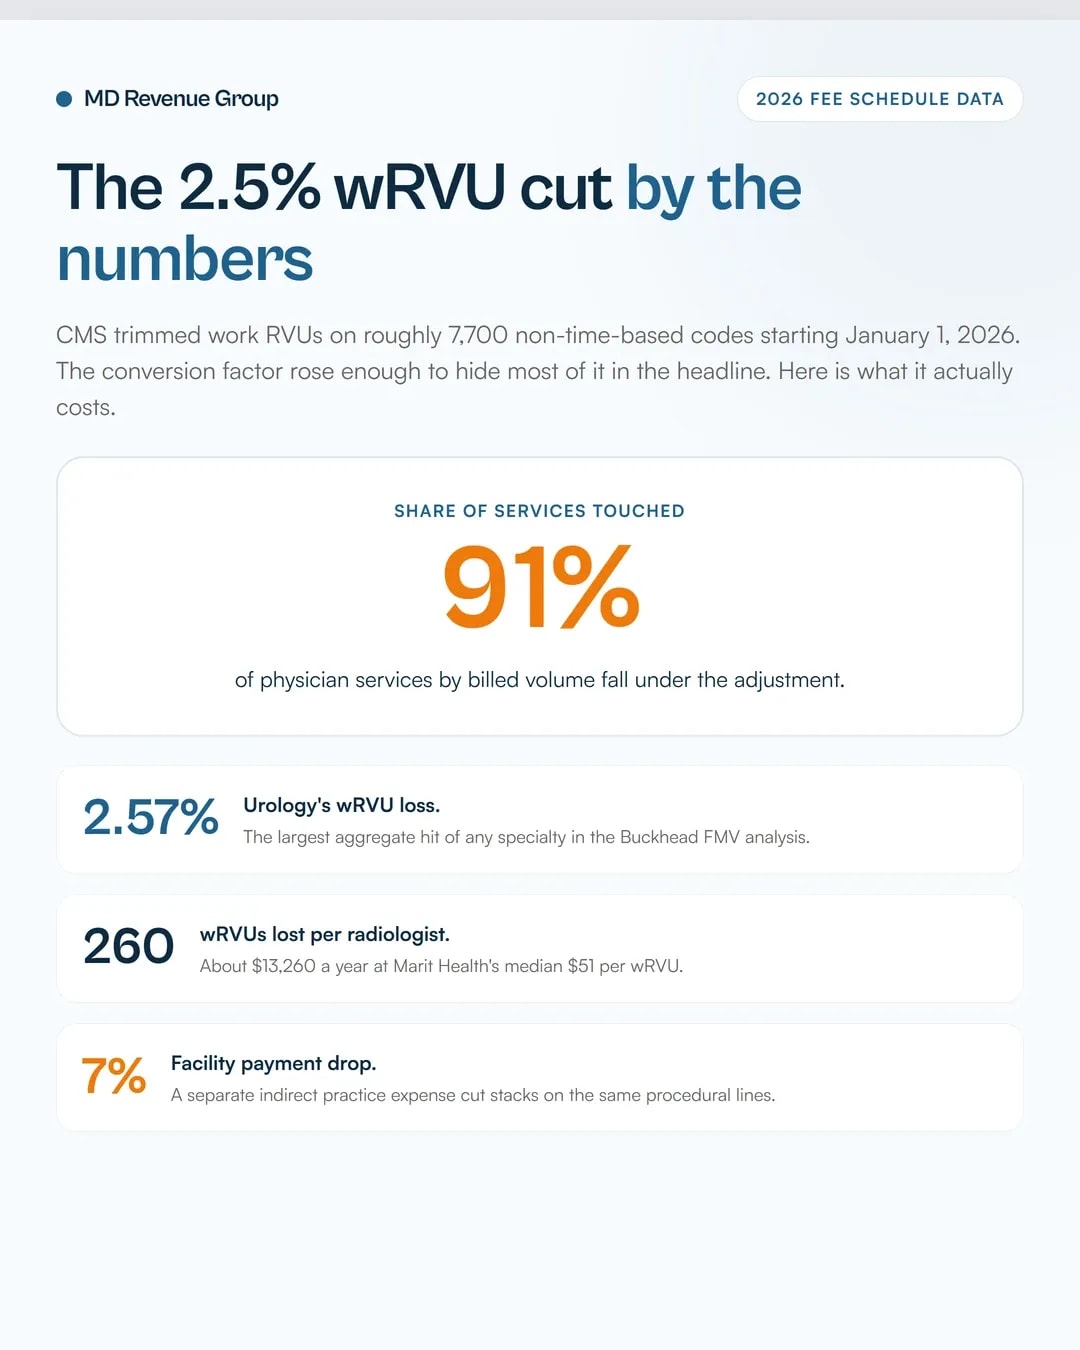
The 2026 wRVU efficiency adjustment cut work RVUs and intraservice time by 2.5% on roughly 7,700 non-time-based CPT codes, effective January 1, 2026. It reaches about 91% of physician services by billed volume. For a urology, orthopedic, interventional cardiology, or radiology practice, that works out to anything from nothing to roughly $13,000 per physician per year.
The conversion factor went up, which is exactly why most practices haven't noticed. CMS set 2026 at $33.5675 for qualifying APM participants and $33.4009 for everyone else, gains of 3.77% and 3.26% (Holland & Knight). That increase more than covered the work RVU cut on paper.
Two things it never covered: the separate practice expense cut on facility-based services, and any physician paid per wRVU on a contracted dollar rate. Both of those hit your bank account. Here is how big each one gets, which codes drive it, and what to do before your November reconciliation closes.
Key takeaways
- The 2026 wRVU efficiency adjustment is a 2.5% cut to work RVUs on about 7,700 codes, covering 91% of physician services by billed volume.
- The conversion factor rose 3.77% for qualifying APM participants and 3.26% for everyone else, which masks the cut in headline numbers.
- Urology takes the largest hit to wRVU production at -2.57%. Diagnostic radiology loses an estimated 260 wRVUs per physician, about $13,260 a year at market rates.
- Facility-based payments drop about 7% overall from a separate indirect practice expense change, on top of the work RVU cut.
- CMS recalculates the adjustment every 3 years, next in 2029. More recent labor data supports 3.6%, so the next one could be larger.
What the efficiency adjustment actually does
CMS built the adjustment by adding the last 5 years of Medicare Economic Index productivity adjustments together. The result was a 2.5% reduction applied across the board to work RVUs and the intraservice portion of physician time for non-time-based services (CMS final rule summary via Holland & Knight).
Two details matter for your budget. First, CMS admitted that using more recent Bureau of Labor Statistics data would have produced a 3.6% cut. It finalized the lower number anyway, describing 2.5% as a measured, incremental first step. Second, it built a recurring methodology: the agency recalculates every 3 years, with the next update in 2029. Holland & Knight flagged that the 2029 number could exceed 2.5%.
The scope shrank between the proposed and final rules. Nearly 9,000 codes were on the original list. CMS added exemptions in the final rule for new 2026 services, time-based drug administration, physical medicine and rehabilitation, therapy services, and remote therapeutic monitoring. That trimmed the list to about 7,700 codes.
Here is the full exemption list, and it is where a practice's exposure is actually decided:
Service category | Status under the 2026 efficiency adjustment |
|---|---|
Office and outpatient E/M visits | Exempt |
Care management services | Exempt |
Behavioral health services | Exempt |
Services on the Medicare telehealth list | Exempt |
Maternity codes with an MMM global period | Exempt |
Time-based drug administration | Exempt |
Physical medicine and rehabilitation | Exempt |
Therapy services | Exempt |
Remote therapeutic monitoring | Exempt |
Surgical procedures, imaging, diagnostic tests, outpatient interventions | Cut 2.5% |
If your revenue mix is mostly E/M, behavioral health, or care management, this rule costs you very little. If it is procedures and imaging, it is the first line item in your 2026 margin analysis. Our CMS 2026 physician fee schedule breakdown covers the rest of the rule, including the telehealth and E/M changes that did survive.
Which specialties lose the most
Two different models are driving the headlines, and they measure different things. Buckhead FMV ran the 2026 wRVU values against MGMA's Procedural Profile service mix data, which shows how much each specialty's wRVU production moves. Becker's ASC Review then applied Marit Health's median dollars per wRVU to SullivanCotter's wRVU loss estimates, which turns the percentage into a paycheck number.
Specialty | Change in wRVU production (Buckhead FMV, MGMA service mix) | wRVUs lost per physician (SullivanCotter) | Median $ per wRVU (Marit Health) | Estimated annual loss per physician |
|---|---|---|---|---|
Urology | -2.57% | Not published | Not published | Largest aggregate hit of any specialty |
Diagnostic radiology | -2.30% | 260 | $51.00 | about $13,260 |
Invasive/interventional cardiology | -2.32% | 139 | $60.00 | about $8,340 |
Orthopedic surgery | Not published | 160 | $70.00 | about $11,200 |
Otolaryngology | Not published | 89 | $64.50 | about $5,741 |
General cardiology | Not published | 73 | $60.00 | about $4,380 |
Neurology | Not published | 28 | $58.40 | about $1,635 |
Internal medicine | -0.05% | 5 | $52.00 | about $260 |
Hematology/oncology | -0.01% | Not published | Not published | Under $300 |
Hospital medicine | -0.01% | Not published | Not published | Under $300 |
Family medicine | Not published | 0 | $52.00 | No change |
Sources: Buckhead FMV specialty analysis, Becker's ASC Review dollar analysis, and SullivanCotter's 2026 PFS data.
A second cut of data comes from the American Medical Association, which modeled the full 2026 rule including the practice expense changes rather than the work RVU change alone:
Specialty | Share of physicians facing a cut of 5% or more | Severity |
|---|---|---|
Infectious disease | 81% | 5% or more |
Internal medicine | 56% | 5% or more |
Ophthalmology | 54% | Cut, size varies |
Oncology | 39% | 10% to 20% |
Obstetrics and gynecology | 34% | Cut, size varies |
Source: AMA, "What to expect from the 2026 Medicare Physician Fee Schedule".
SullivanCotter published a second, updated set of estimates in April 2026 that folds in every 2026 change. Those put diagnostic radiology at -3.1% and invasive cardiology at -1.7%, with small gains for internal medicine and family medicine. If you budget off a single number, use the April update.
What it costs per case
The work-side loss per case is small. The total payment drop is not, because practice expense moved separately.
Code and service | 2025 work RVUs | 2026 work RVUs | wRVU loss | Dollar loss on the work side | Total national payment change |
|---|---|---|---|---|---|
27130 / 27447, total hip and knee replacement | 19.60 | 19.11 | 0.49 | about $16.37 | down about 7.8%, to roughly $1,160 |
66984, cataract surgery | 7.35 | 7.17 | 0.18 | about $6.01 | down $58.81, from $521.75 to $462.94 |
Dollar figures use the 2026 nonqualifying conversion factor of $33.4009. RVU sources: American Association of Hip and Knee Surgeons and American Society of Cataract and Refractive Surgery, as reported by Becker's ASC Review.
Read the cataract line twice. The efficiency adjustment cost $6.01 per case. Total payment fell $58.81. The other $52.80 came from practice expense, where cataract PE RVUs dropped from 8.23 to 6.16 under the separate facility-based cut.
That gap is the whole story of 2026. Anyone modeling "2.5%" against a 2025 remittance total is modeling roughly one-fifth of what actually happened on facility-based procedural lines.

The facility versus office twist
For services furnished in a facility setting, CMS reduced the portion of indirect practice expense RVUs tied to work RVUs to half the amount applied in non-facility settings. The change is budget neutral overall. It moves money from hospital and ASC-based specialties to office-based ones (Holland & Knight).
The AMA's read on the combined effect is blunt: physician payment for services performed in a facility drops about 7% overall (AMA).
Practically, where a service happens now changes the check. Same CPT code, same patient outcome, different building, materially different payment. Practices that set their site-of-service pattern years ago under an older PE methodology are running on a model CMS has since replaced. Auditing your top revenue codes against current RVU files is the only way to know which side of that shift your volume landed on.
Why 2027 makes the number worse
The 2026 conversion factor gain was temporary. Public Law 119-21 gave Medicare a one-year 2.5% increase that expires after 2026, and CMS's proposed 2027 rule reflects that expiration.
Metric | 2026 final | 2027 proposed | Change |
|---|---|---|---|
Qualifying APM conversion factor | $33.5675 | $33.17 | -$0.40, or -1.19% |
Nonqualifying APM conversion factor | $33.4009 | $32.84 | -$0.56, or -1.68% |
One-time 2.5% statutory increase | In effect | Expires | -2.50% against 2026 |
Statutory update, qualifying APM | +0.75% | +0.75% | No change |
Statutory update, nonqualifying APM | +0.25% | +0.25% | No change |
Work RVU budget neutrality adjustment | +0.49% | +0.53% estimated | No change |
Source: CMS CY 2027 Physician Fee Schedule proposed rule fact sheet.
Run the cataract work portion through that. It was about $237.75 in 2025 and about $239.48 in 2026, up slightly despite the wRVU cut. At the proposed $32.84 conversion factor, it drops to about $235.47, below 2025. The knee replacement work portion goes from about $638 to about $628.
Two structural changes ride along with it. CMS proposes paying the most expensive service at 100% when a physician or practice bills both a standalone E/M visit and a 0-, 10-, or 90-day global procedure on the same day, with every other procedure or E/M visit that day paid at 50%. And G2211 would move from a flat add-on code to a percentage-based modifier worth 16% of the associated E/M base code.
Both of those are covered in our CY 2027 proposed rule action plan, with the same-day E/M and global overlap modeled line by line in Global Surgery and Same-Day E/M in 2027. Start both reviews now. Neither change is final, so run your 2027 modeling against the proposal and update it when CMS publishes the final rule.
Why employed physicians take the full hit
An employed physician on a productivity contract gets paid wRVUs multiplied by a contracted dollar rate. That math never sees the conversion factor increase.
Unless the employer holds 2025 RVU values frozen, the same clinical work now produces fewer credited wRVUs and less compensation, even while the billing entity's Medicare check went up. MGMA and PYA both flagged procedure-heavy and imaging-heavy groups on formula-based wRVU incentives as the most exposed, along with any group whose commercial contracts or benchmarks are tied to wRVU counts (MGMA, PYA).
SullivanCotter's 2026 survey of roughly 235,000 physicians across 575 organizations shows how far the gap has opened. Total cash compensation for general, cardiac, and pediatric anesthesiology is up 14% to 16% since 2024, and diagnostic, interventional, and mammography radiology is up 12% to 18%. Over the same period, wRVU productivity rose 2.8% in adult medical specialties and 0.8% in primary care.
Two procedural groups are fighting the policy in Congress. The American College of Surgeons points to a study of 1.7 million procedures in its National Surgical Quality Improvement Program, published in the Journal of the American College of Surgeons, which found operative times rose 3.1% from 2019 to 2023. Reps. Ron Estes (R-Kan.) and Tom Suozzi (D-N.Y.) introduced H.R. 7520, the Efficiency Adjustment Delay Act, on February 12. It would delay the adjustment until at least 2030, require CMS to justify it, and exempt services reviewed in the past 10 years.
Watch that bill, but don't plan around it. If your group runs on wRVU thresholds, revenue cycle management planning that assumes the 2.5% cut is permanent is the safe assumption.
What your practice should do now
Pull your top 20 codes by billed volume. Download the 2026 RVU file for each one from CMS. Subtract the 2025 value. That is your exposure in wRVUs, and it takes an afternoon.
Then multiply by what you actually collect per wRVU on your commercial mix. Use your own numbers here, not the $51 and $60 medians. Medicare is a slice of most independent practices' revenue, and your commercial contracts may carry their own wRVU-linked escalators that reset on a different schedule.
Model the site-of-service shift separately. For each procedure-heavy code, check whether your indirect PE RVUs moved up or down under the facility half-rate rule. A practice that shifted volume to the office in past years may have gained here. One that sits in the hospital may have lost twice.
Bring the numbers to contract negotiations. A 2.5% Medicare work RVU cut with a 7% facility payment drop is a documented, sourced fact about your cost base. That is a stronger argument in a fee-schedule discussion than a general request for an increase.
Review your compensation plan thresholds against current RVU values. Every productivity target set on 2025 wRVU numbers now requires about 2.6% more work to hit, and more for facility-based procedural codes.
Track 2029 and H.R. 7520. The adjustment recurs every 3 years, CMS has said more recent data supports 3.6%, and the delay bill could push the whole thing to 2030 or later.
Get your exact 2026 wRVU exposure
Every number in this article is a specialty average. Your practice's number depends on your codes, your site of service, your payer mix, and your contract terms. We build that model from your own claims data and show you the codes driving it. Request a free audit and we'll run the wRVU delta on your top revenue lines.
Frequently asked questions
It is a 2.5% reduction CMS applied to work relative value units and intraservice physician time for most non-time-based CPT codes, effective January 1, 2026. CMS built it from five years of Medicare Economic Index productivity data. It applies to roughly 7,700 codes, about 91% of physician services by billed volume. Time-based codes like E/M are exempt.
Urology takes the largest aggregate hit, down 2.57% in wRVU production, followed by invasive and interventional cardiology at -2.32% and diagnostic radiology at -2.30%. Per physician, diagnostic radiology loses an estimated 260 wRVUs a year, worth roughly $13,260 at a median $51 per wRVU. Orthopedic surgery loses an estimated 160 wRVUs, about $11,200. Internal medicine loses about $260.
It applies only to work RVUs, and only to non-time-based codes. A separate change cut indirect practice expense RVUs for facility services to half the office-based amount, which the AMA says drops facility-based physician payment by about 7%. Both changes stack on the same procedural lines.
CMS recalculates it every 3 years. The 2026 version is the first, and the next update lands in 2029. CMS said more recent Bureau of Labor Statistics data would have supported a 3.6% cut for 2026. A pending bill, H.R. 7520, would delay the adjustment until at least 2030.
Pull your top 20 codes by billed volume, compare each 2026 work RVU value against 2025, and multiply the difference by what your practice collects per wRVU on each payer. Add the facility practice expense change separately for procedures billed in a hospital or ASC. Then check whether your comp plan indexes off wRVU counts.
Get your exact 2026 wRVU numbers
The specialty averages in this article will not tell you what the 2.5% efficiency adjustment costs your practice. Only your claims data will, and it takes us a few days to build. We map your top codes against 2026 RVU values, isolate the facility practice expense shift, and show you where the money actually went. Request a free audit and we'll put the numbers on your service mix.